
Oversold indicators offer good news...and bad news

Key points
- The stock market has plunged, and many reliable indicators are flashing "oversold" signals
- The good news is that stocks have shown a strong tendency to trade higher twelve months after these types of signals
- The bad news is that there is also a strong tendency for things to "get worse before they get better"
Where we stand
I follow hundreds of indicators and over a thousand potential "signals" they can trigger. After the close on Friday, April 4th, my scan lit up with many signals, mostly all "favorable." That's the good news. The bad news is that, in this case, a "signal" is primarily "weight of the evidence" and not necessarily an outright "buy signal." Likewise, many of the signals that triggered fall into the "typically favorable (i.e., 80% of higher Win Rate six to twelve months out) category." But what happens in the interim is a) often close to a coin flip, and b) there is no guarantee that things won't get worse (sometimes even much worse) before they get better.
With that frame of reference in mind, let's look at one typically useful indicator that recently generated such a signal.
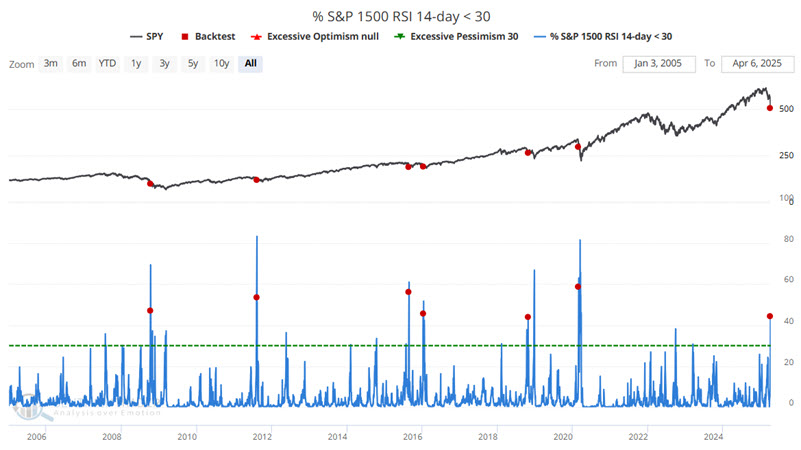
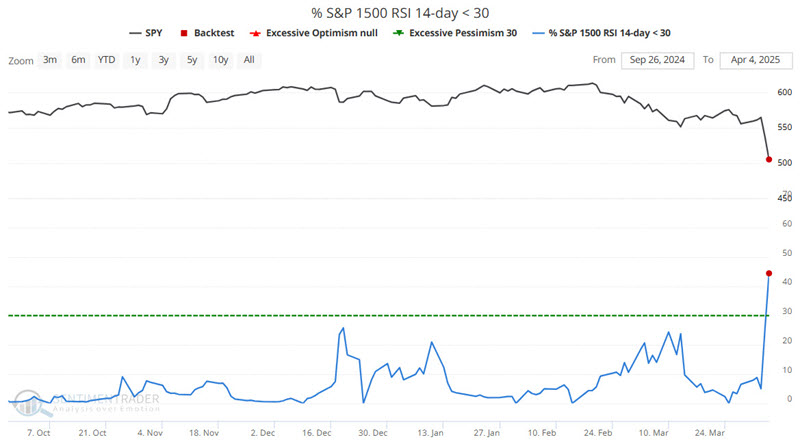
The percentage of S&P 1500 stocks with 14-day RSI < 30 spikes
As the name implies, this indicator calculates 14-day RSI values for each of the S&P 1500 stocks and reports the percentage of those stocks showing a 14-day RSI reading below 30. The 2025-04-04 reading of 44.46 tells us that 667 of the 1500 stocks in the index have a 14-day RSI reading below 30. The chart below highlights those dates when this indicator crossed above 40% for the first time in three months.
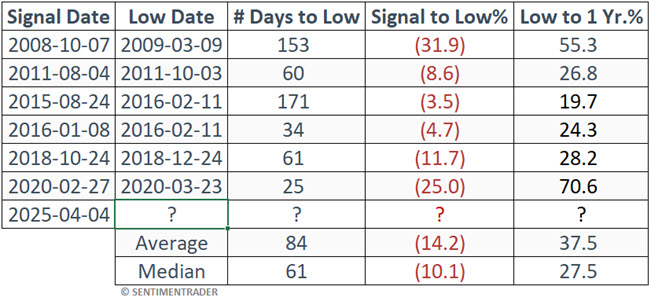
The tables below highlight the "good news/bad news" proposition discussed above. The S&P 500's performance has historically been relatively dismal during the first two months after a "signal." However, six and especially twelve months later, the market performed exceptionally well.
The table below displays SPY performance for various time periods on a signal-by-signal basis.
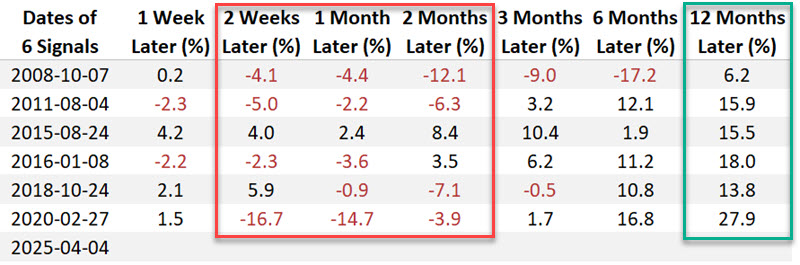
Note in the table above that buying SPY two months after the signal and selling twelve months after the signal would have resulted in a sizeable profit. That said, there is no guarantee that will be the case this time around.
The table below summarizes SPY performance during the twelve months following the above signal dates.
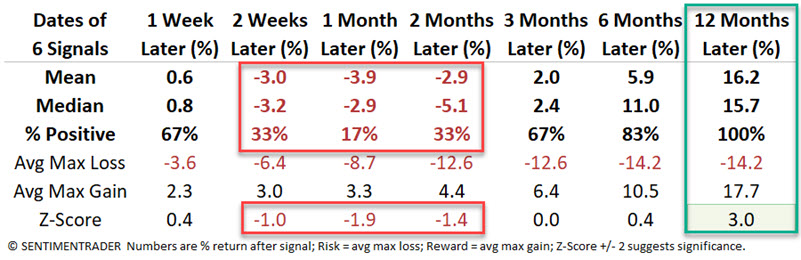
Here, we can address the crucial difference between "analysis" and "actual trading." As an analyst, I could confidently state that "the S&P 500 Index has been higher a year later 100% of the time, with an average gain of 15.7%, " which, as a standalone item, is valuable.
However, as a real-world trader, the real question (in my mind) is NOT "Where will the market be a year from now?" but rather, "How bad might things get before things get better?" So, let's examine this reality a little more closely.
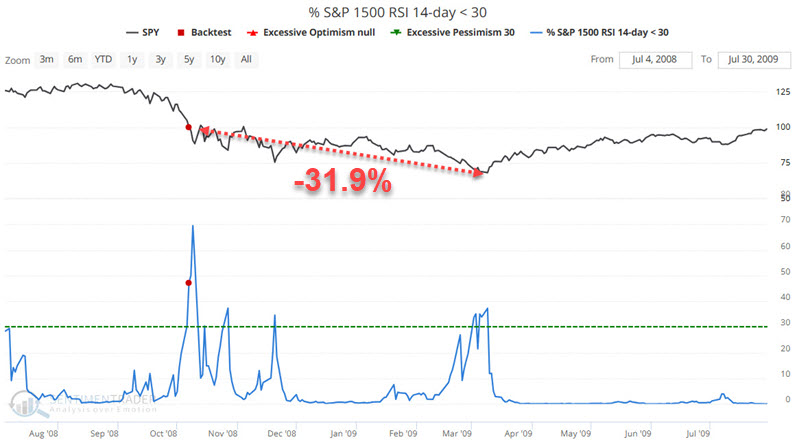
The chart below displays the 2008-10-07 signal. In this case, ticker SPY did not bottom out until 2009-03-06, following a decline of 31.9%. From the bottom to one year after the signal, SPY rallied 55.3%.
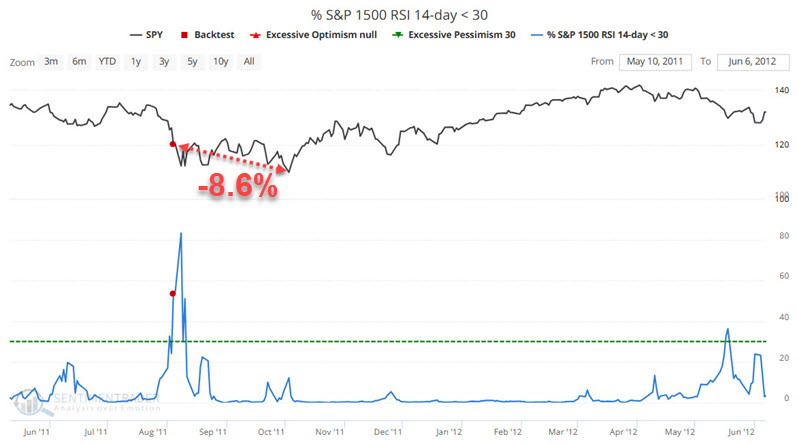
The chart below displays the 2011-08-04 signal. SPY bottomed out 60 days and 8.6% lower on 2011-10-03. From the bottom to one year after the signal, SPY rallied 26.8%.
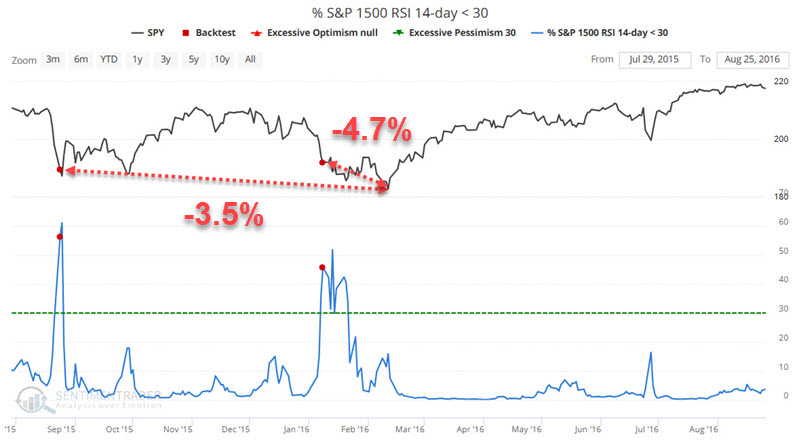
The chart below displays both the 2015-08-24 and 2016-01-08 signals. SPY bottomed out on 2016-02-11, 171 days and 34 days later, respectively, and -3.5% and -4.7% lower than on the respective signal dates. From there to one year from each signal, SPY rallied 19.7% and 24.3%.
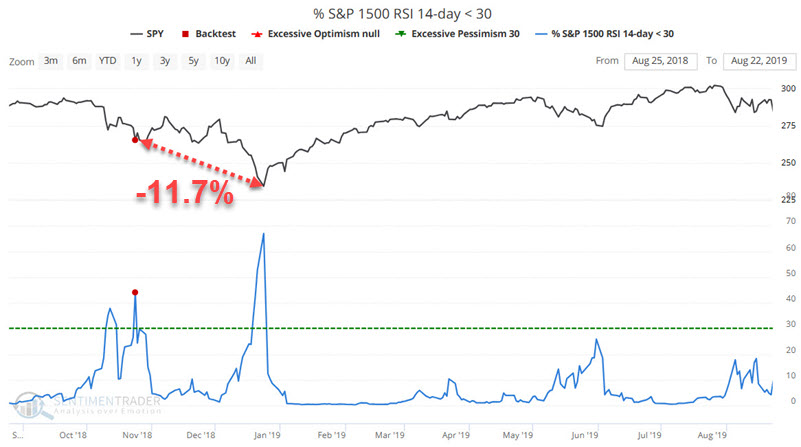
The chart below displays the 2018-10-24 signal. SPY bottomed out 61 days and -11.7% lower on 2018-12-24. From the bottom to one year after the signal, SPY rallied 28.2%.
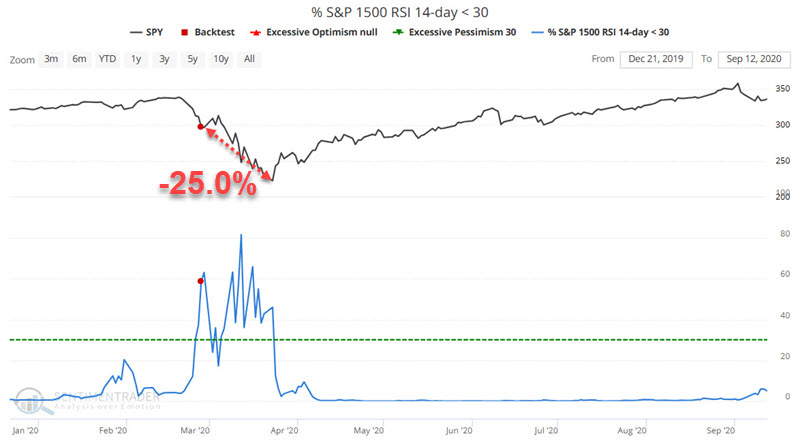
The chart below displays the 2020-02-27 signal. SPY bottomed out 25 days and -25.0% lower on 2020-03-23. From the bottom to one year after the signal, SPY rallied 70.6%.
The table below summarizes SPY performance following the signals displayed above.
The chart below displays the latest signal on 2025-04-04.
What the research tells us…
I may highlight other indicator signals like the one detailed above in the days ahead. The signal highlighted here essentially falls under the category of "NOT a buy signal, but rather a start looking for a buy signal" signal. While this is only one indicator, the takeaway is that if history is a guide, the stock market still has (potentially significant) downside left before it bottoms and/or that that bottom could be anywhere from one to six (but most likely two to three) months away.