
Overbought conditions are indicative of bullish price momentum

Key points:
- The S&P 500 cycled from an extremely oversold condition to an overbought one
- After similar oversold-to-overbought reversals, the S&P 500 was higher 93% of the time over the next year
- When Technology shifts from oversold to overbought, like now, it was higher a year later every time
Should we embrace or fade the overbought condition?
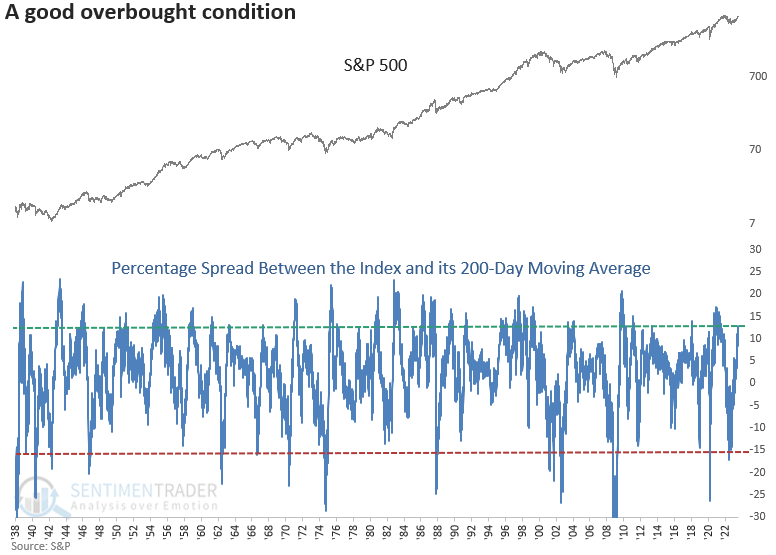
One prominent topic gaining traction on social media revolves around the S&P 500 and the Technology sector's overbought condition. The unease centers on the indexes' substantial deviation above their 200-day moving averages, potentially creating a vulnerable market environment.
In a recent note, I discussed the significance of overbought conditions as a sign of positive momentum, highlighting the surge in the Relative Strength Index (RSI). Now, let's delve into the extension above the 200-day moving average and, as always, apply the proper context to the setup.
The S&P 500 fell 17.13% below its 200-day moving average in June 2022 and subsequently reversed higher, increasing 12.77% above the average as recently as 2023-07-18.
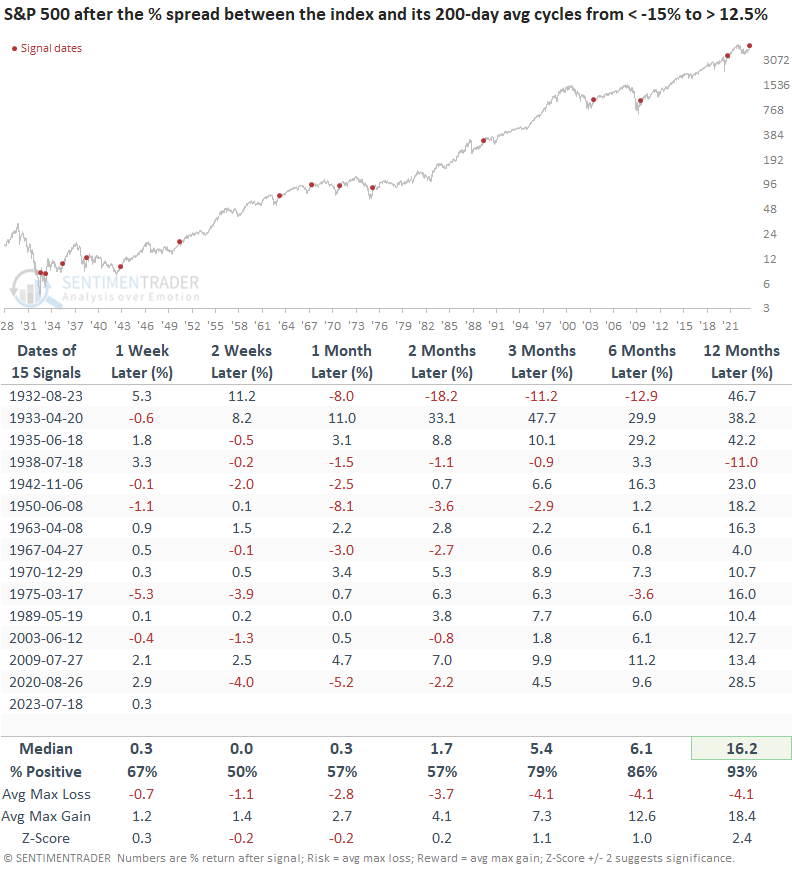
Let's adjust the parameters and identify a reversal from < -15% to > 12.5% to see if we should be concerned about the overbought condition.
Similar shifts from significantly below to above the 200-day average preceded excellent returns
When the S&P 500 transitions from 15% below its 200-day moving average to 12.5% above, the index is higher a year later in all but one instance, and it showed a gain at some point every time.
Based on the returns and win rates over the next month, the evidence favoring a brief overbought pullback scenario lacks overwhelming support.
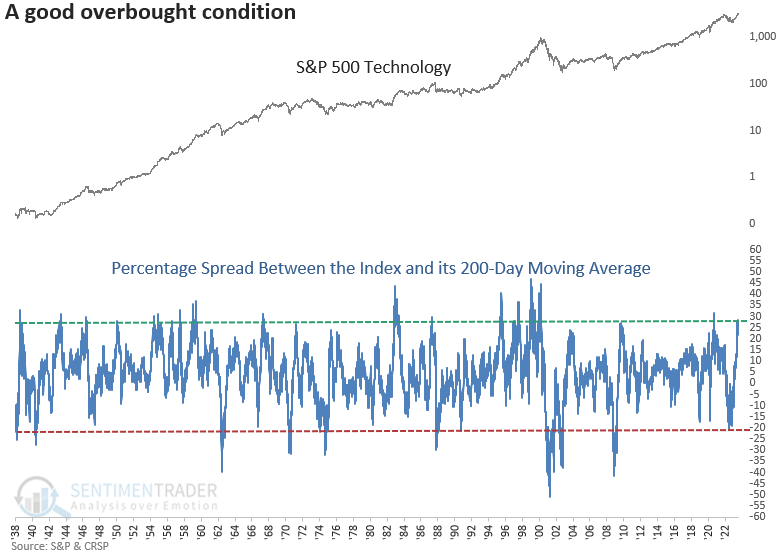
What about Technology, which is even more extended above its long-term average?
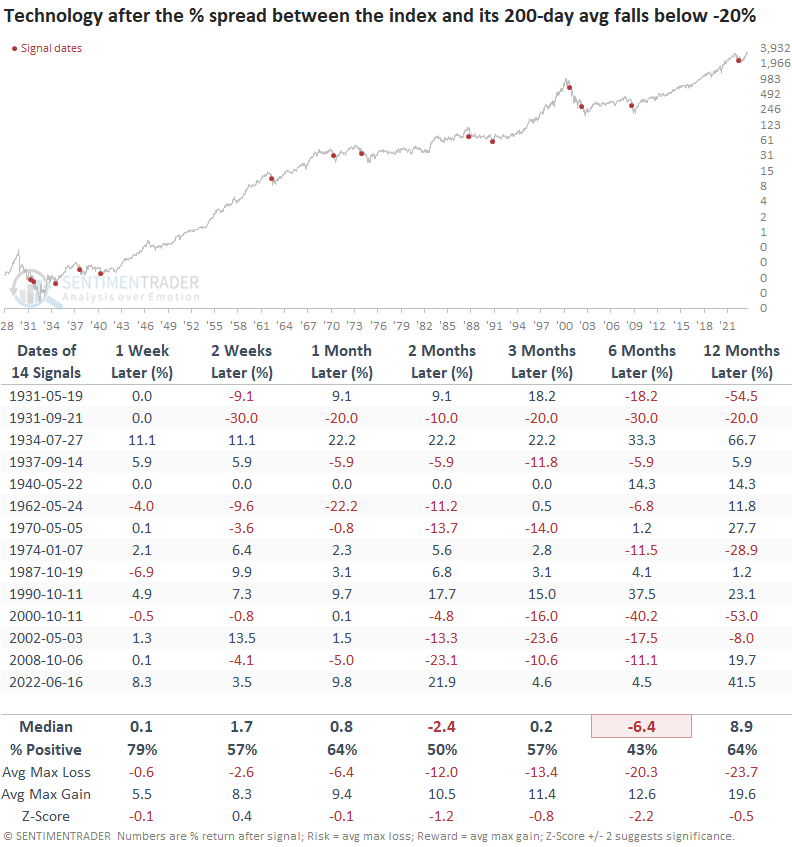
The Technology sector fell 20.87% below its 200-day moving average, creating the most oversold condition since the GFC. It subsequently reversed higher, increasing to 28.57% above the average as of 2023-07-18.
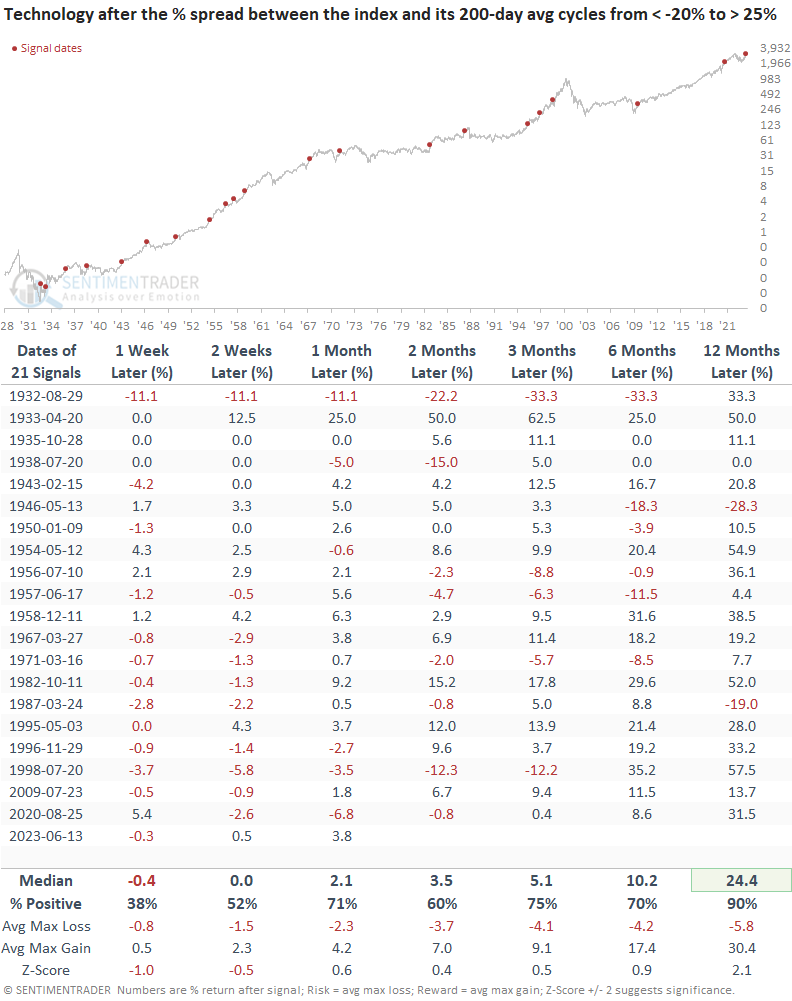
Let's assess the outlook for the Technology sector when the spread cycles from less than -20% to greater than 28%.
In contrast to the S&P 500, there is a more compelling case for a consolidation or pullback in the first month, a trend that has already surfaced within the first week. Nevertheless, maintaining perspective is essential, as the sector has consistently rallied one year later in all previous instances.
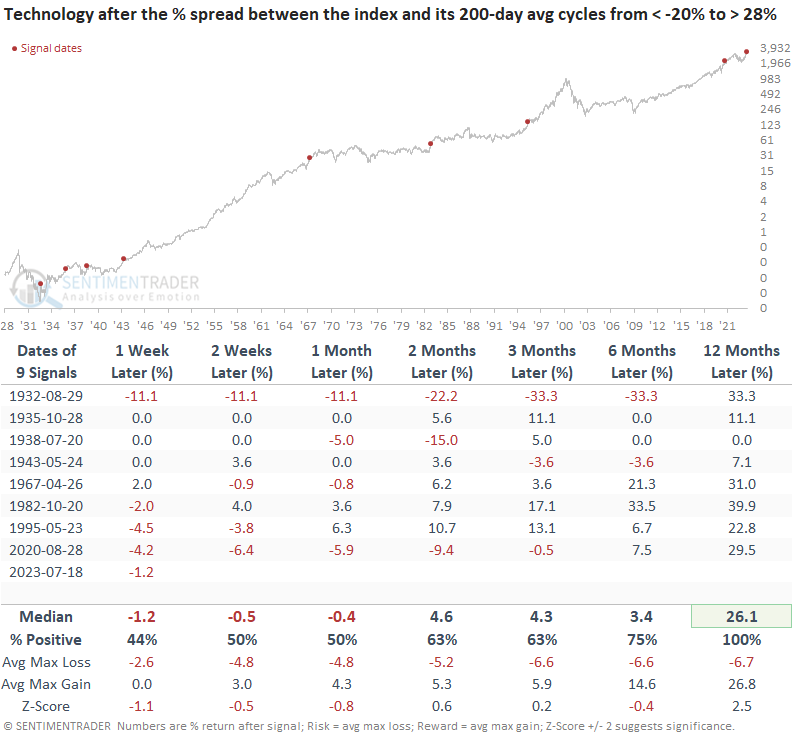
Let's adjust the overbought threshold to 25% to increase the sample size. Similar to the original study, the results suggest a near-term digestion period, followed by a continuation of the bullish price momentum over the coming year.
Would you rather buy oversold or overbought conditions?
Extreme oversold conditions like last year, when the Technology sector fell 20% below its 200-day average, indicate negative price momentum. While prices can bounce in the short term, it's a dangerous environment on a medium-term basis and, in some cases, over longer horizons.
Remember, the playbook is to buy oversold conditions in uptrends and sell overbought conditions in downtrends.
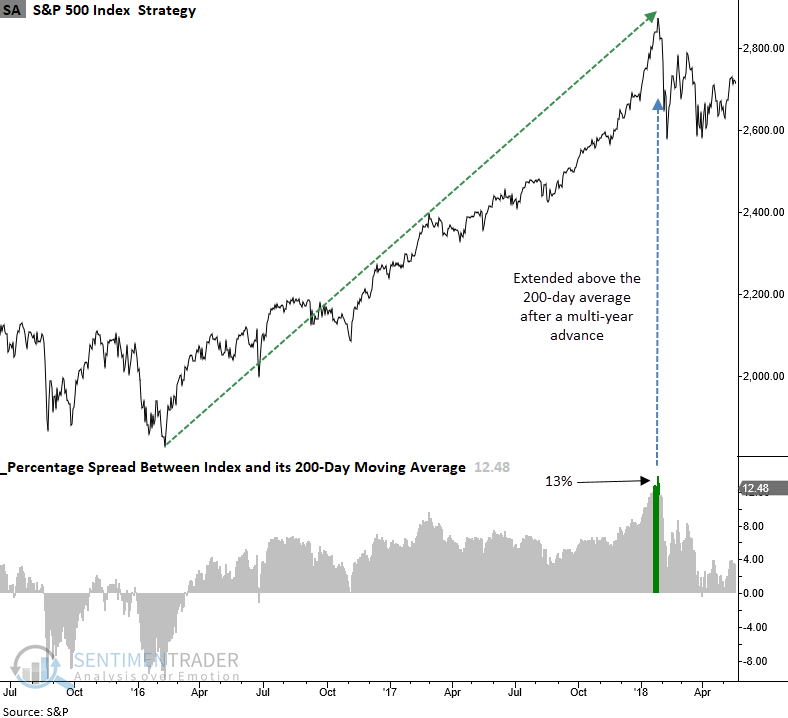
When should we be concerned about an overbought condition?
Historically, an extension above the 200-day moving average, like in January 2018, creates a problem for the S&P 500 when the index has advanced for a minimum of 280 trading days without registering a 3-month low. The count for the current advance stands at 198 trading sessions.
What the research tells us...
Whether measuring sentiment, breadth, or price-based indicators, the initial phase of a reversal from an oversold/pessimistic condition to an overbought/optimistic environment is a highly positive and encouraging long-term development that investors should embrace. While anything can happen in the short run, market participants should keep sight of the big picture, which suggests higher stock prices over the next year.