Data &
Technology
Research
Reports
Report Solutions
Reports Library
Actionable
Strategies
Free
Resources
Simple Backtest Calculator
Simple Seasonality Calculator
The Kelly Criterion Calculator
Sentiment Geo Map
Public Research Reports
Free Webinar
Pricing
Company
About
Meet Our Team
In the News
Testimonials
Client Success Stories
Contact
Log inLoginSign up
< BACK TO ALL REPORTS

Over 6 Months Without Even a 5% Haircut

Jason Goepfert
2021-05-19
The S&P 500 has gone 134 trading days without even a 5% pullback from a high. That's among the longest streaks since 1928, and preceded choppy medium-term returns before momentum tended to resume.

The bears tried. They failed but seem to be making another run today.

After letting some air out of Tech stocks and some former highfliers, bulls have made a stand and kept the broader market steady. Once again, sellers failed to push the S&P 500 down even 5% from its peak. It got close last week but held above that threshold.

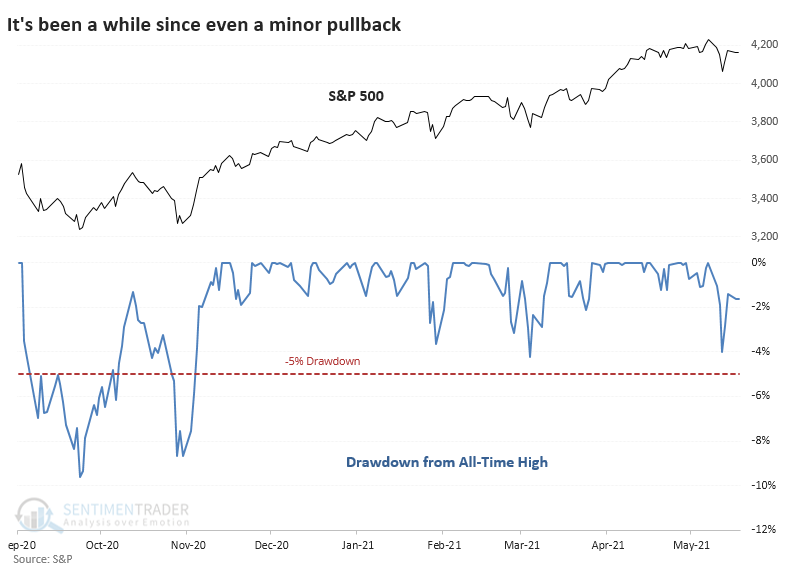
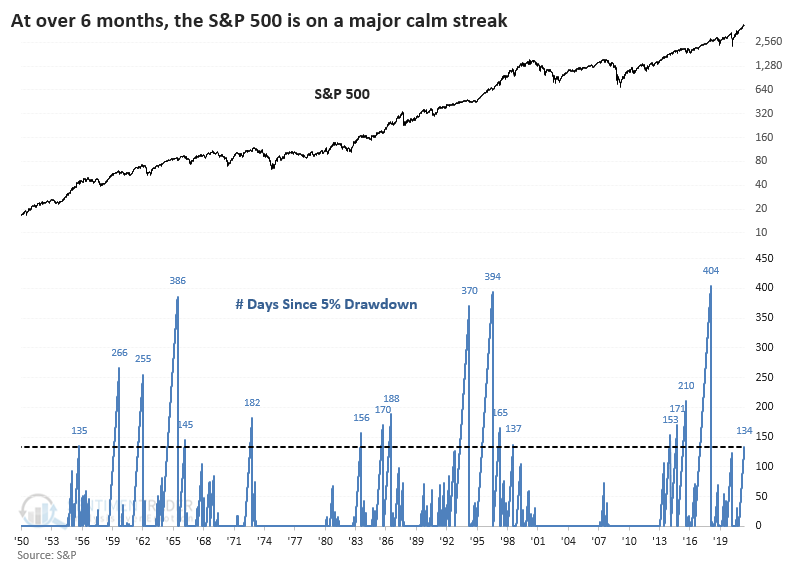
The index has now gone 134 trading days without a 5% pullback. That's the 18th-longest streak since 1928, and it would take only a few more days to push it into 15th place.

MOMENTUM CONTINUED...WITH A PAUSE

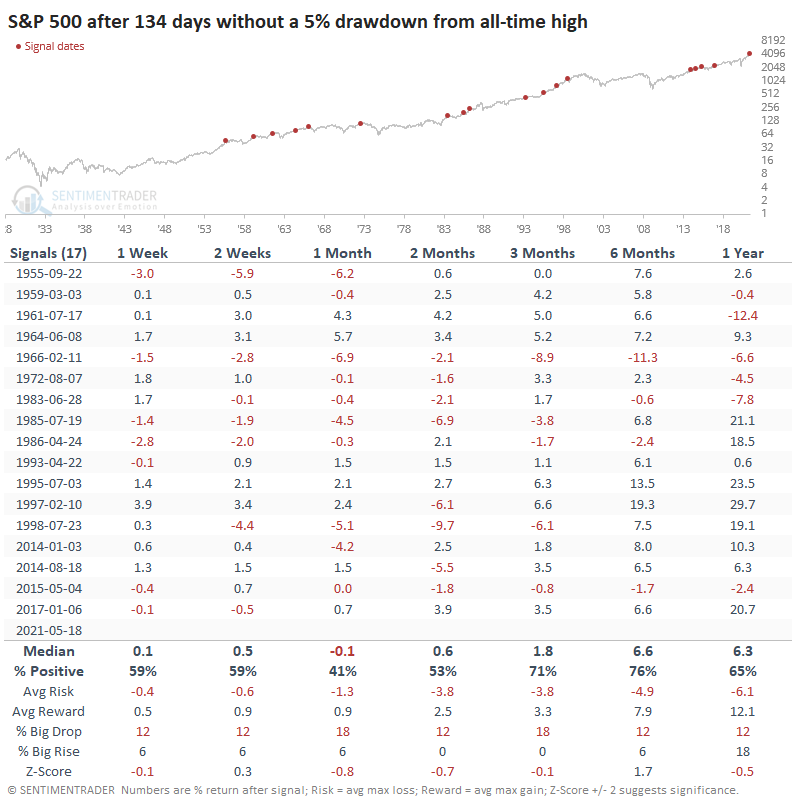
Once it got this extended, the S&P's returns over the next month were poor. Even up to 3 months later, its risk outweighed its reward. But as we've seen with so many momentum studies, when buyers have been so persistent, they didn't give up easily, and there were few large declines to speak of.

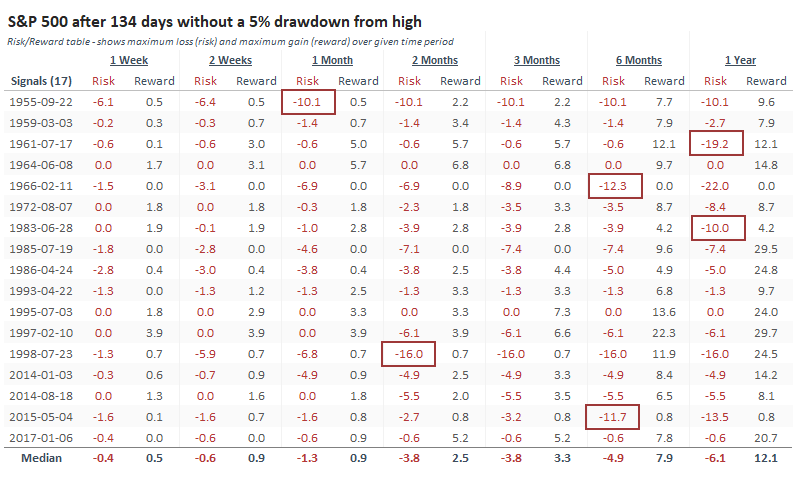
The Risk/Reward table highlights those signals when the index fell more than 10% from the signal date. Only 2 out of the 17 signals suffered that fate within the first 3 months. Within the next year, 6 of the 17 suffered at least a 10% drawdown, though only 1 extended to 20%.

An interesting wrinkle with our current situation is that Technology stocks have already fallen by more than 5% from their peak and remain so.

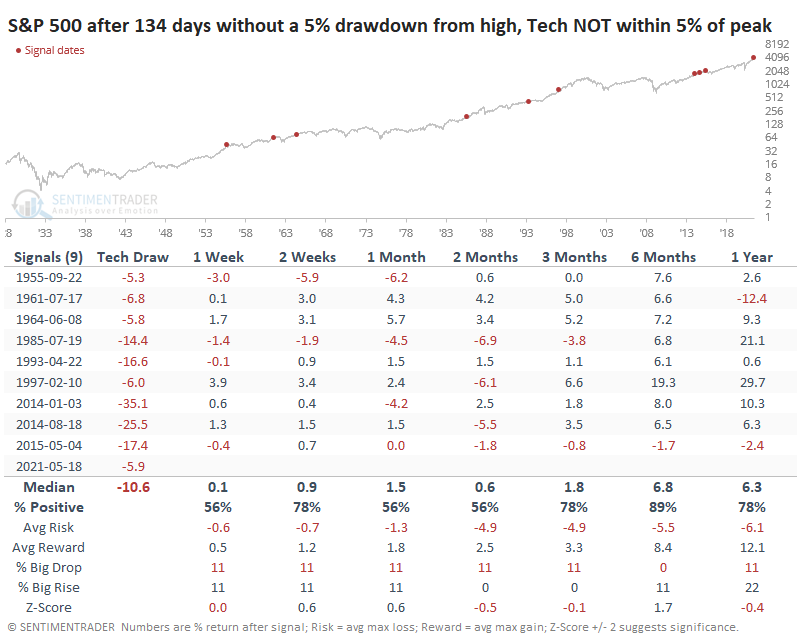
When Tech was leading the S&P to the downside, it didn't make things worse - if anything, returns were a bit better. It still wasn't a great sign over the medium-term, but over the next 6 months, there was only a single small loss.

We've seen time and again in recent weeks (and months) that momentum like we've witnessed so far in 2021 has a habit of preceding choppy medium-term conditions. Such intense buying interest typically doesn't just dry up for long, however, and 6-12 month returns tend to be above average. 

Sorry, you don't have access to this report

Upgrade your subscription plan to get access
Go to Dasboard
DATA &
TECHnologies
IndicatorEdge
‍
BackTestEdge
‍
Other Tools
‍
DataEdge API
RESEARCH
reports
Research Solution
‍
Reports Library
‍
actionable
Strategies
Trading Strategies
‍
Smart Stock Scanner
‍
FREE
RESOUrCES
Simple Backtest
Calculator
Simple Seasonality
Calculator
The Kelly Criterion
Calculator
Sentiment Geo Map
‍
Public Research Reports
‍
Free Webinar
COMPANY
‍
About
‍
Meet our Team
‍
In the News
‍
Testimonials
‍
Client Success Stories
Pricing
Bundle pricing
‍
Announcements
‍
FAQ
© 2024 Sundial Capital Research Inc. All rights reserved.
Setsail Marketing
TermsPrivacyAffiliate Program
Risk Disclosure: Futures and forex trading contains substantial risk and is not for every investor. An investor could potentially lose all or more than the initial investment. Risk capital is money that can be lost without jeopardizing ones’ financial security or life style. Only risk capital should be used for trading and only those with sufficient risk capital should consider trading. Past performance is not necessarily indicative of future results.

Hypothetical Performance Disclosure: Hypothetical performance results have many inherent limitations, some of which are described below. No representation is being made that any account will or is likely to achieve profits or losses similar to those shown; in fact, there are frequently sharp differences between hypothetical performance results and the actual results subsequently achieved by any particular trading program. One of the limitations of hypothetical performance results is that they are generally prepared with the benefit of hindsight. In addition, hypothetical trading does not involve financial risk, and no hypothetical trading record can completely account for the impact of financial risk of actual trading. for example, the ability to withstand losses or to adhere to a particular trading program in spite of trading losses are material points which can also adversely affect actual trading results. There are numerous other factors related to the markets in general or to the implementation of any specific trading program which cannot be fully accounted for in the preparation of hypothetical performance results and all which can adversely affect trading results.

Testimonial Disclosure: Testimonials appearing on this website may not be representative of other clients or customers and is not a guarantee of future performance or success.