Products
SentimenTrader Trading Tools
‍
Backtest Engine
My Trading Toolkit
Correlation Analysis
Seasonality
Market Prediction
Indicators & Data API
‍
Proprietary Indicators & Charts
Market Data API
Strategies & Scanner
‍
50+ Trading Strategies
Smart Stock Scanner
Smart Option Scanner
Research Reports
‍
Research Solutions
Reports Library
Free Resources
Simple Backtest Calculator
Simple Seasonality Calculator
The Kelly Criterion Calculator
Sentiment Geo Map
Public Research Reports
Education
Sentiment Indicators
Technical Indicators
Pricing
Company
About
In the News
Testimonials
Client Success Stories
Contact
Log inLoginSign up
< BACK TO ALL REPORTS

Outperformance by global indexes bodes well for a new cyclical upswing in stocks

Dean Christians
2025-05-12
For only the 10th time since 1972, the proportion of MSCI country indexes outperforming the U.S. over the last six months cycled from less than 20% to greater than 90%. Comparable performance trend shifts saw the MSCI World Index and the S&P 500 rise 100% of the time over the subsequent six months.

Key points: 

  • Over the last six months, more than 90% of MSCI country indexes have outperformed the USA
  • Similar relative trends led to gains in a global index 100% of the time over the next five, six, and twelve months
  • The S&P 500 rose 100% of the time over the following six months and outperformed a world index

The beginning of sustained global equity leadership, or a classic head fake? 

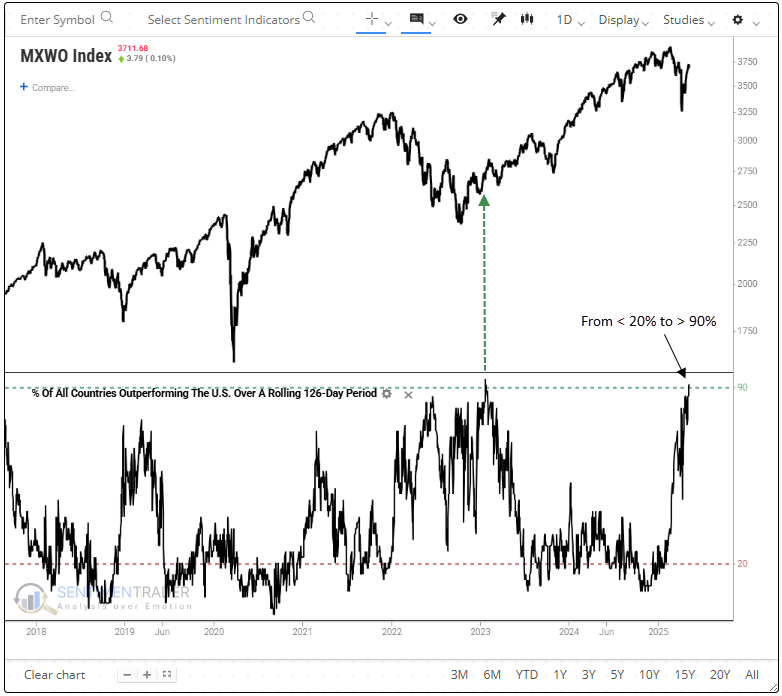
International equities have outperformed, with over 90% of MSCI Country indexes surpassing the MSCI United States Index during the past six months.

Although some suggest the era of U.S. exceptionalism is fading and a global equity rotation is gaining traction, the central question remains: Can this outperformance persist as trade tensions subside? While definitive answers lie in hindsight, history may offer some perspective. 

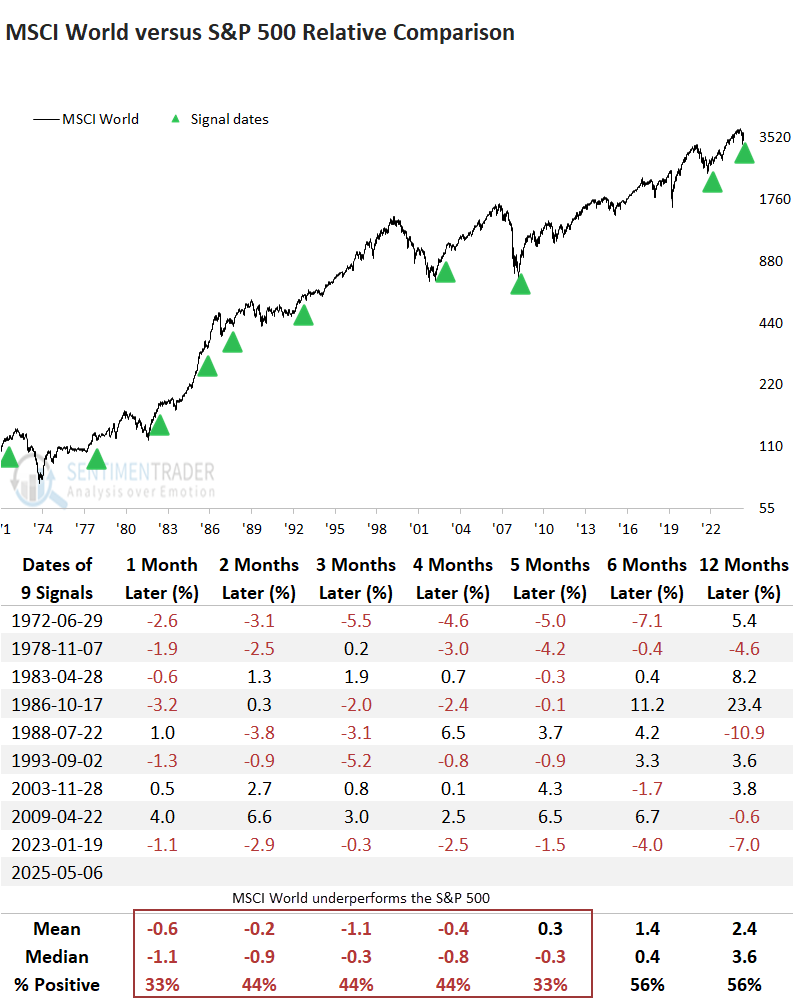
As illustrated in the chart below, the last time the percentage of country indexes outperforming the U.S. over a rolling six-month period cycled from below 20% to above 90%, equities were in the initial stages of emerging from the 2022 bear market. Will history repeat?

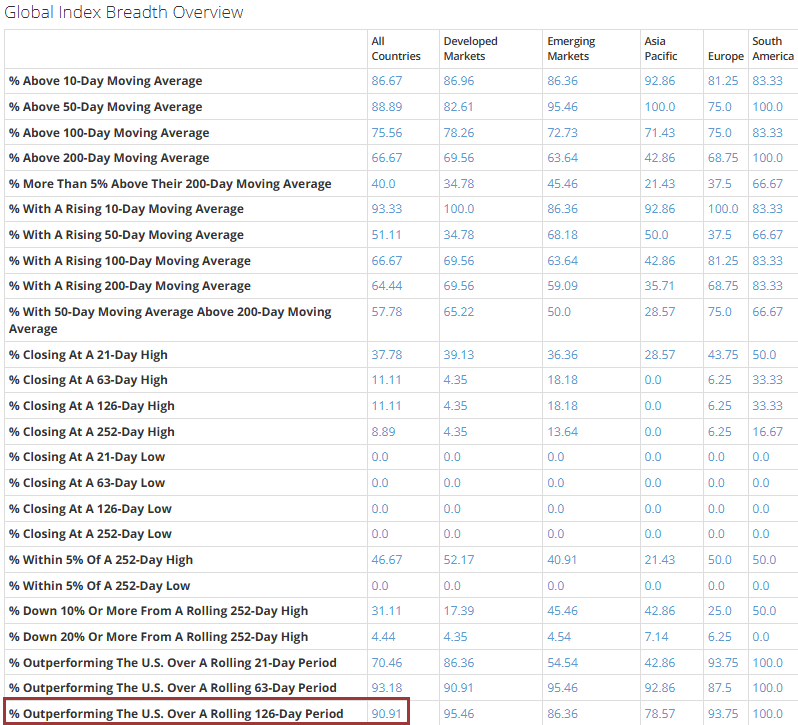
Our Global Index Breadth Overview page features 35 indicators, including the rolling six-month percentage of country indexes outperforming the U.S., segmented by region, developed and emerging markets, and all countries. Our backtest engine fully supports these indicators. Access today's signal here. 

Similar global index relative trends preceded a bullish outcome

Whenever the proportion of MSCI country indexes outperforming the U.S. index over a rolling six-month period cycled from below 20% to above 90%, the MSCI World Index rose over the subsequent five, six, and twelve months without exception. Furthermore, the five and six-month windows exhibited significance relative to random returns.

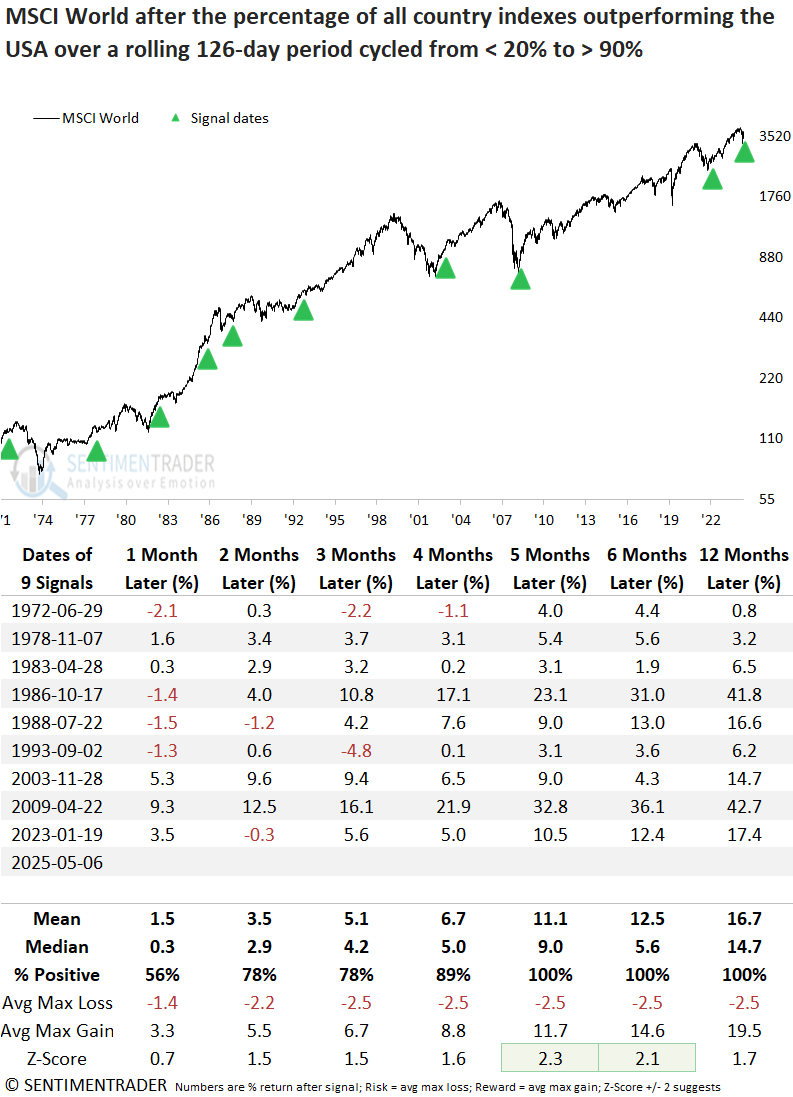
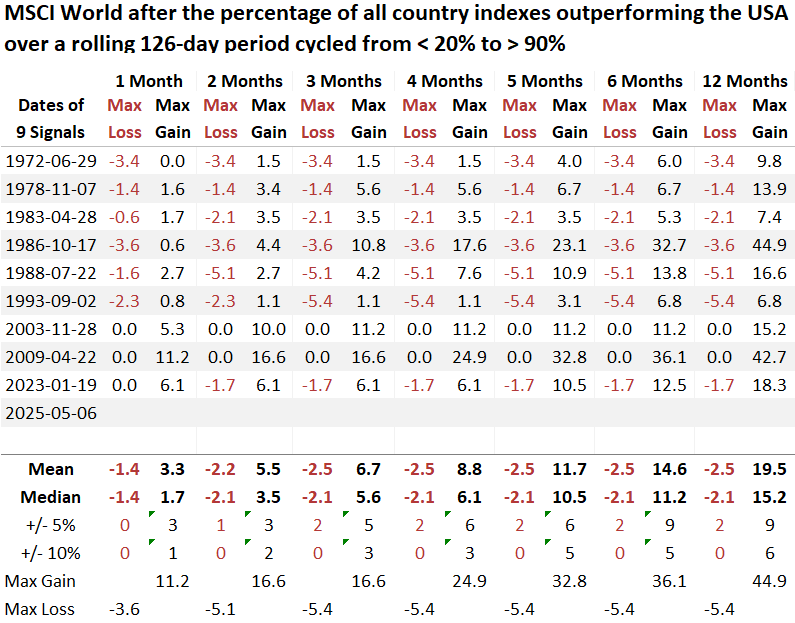
Over the following twelve months, the MSCI World Index experienced just two maximum losses greater than 5%, with none exceeding 10%, indicating a favorable risk/reward environment. 

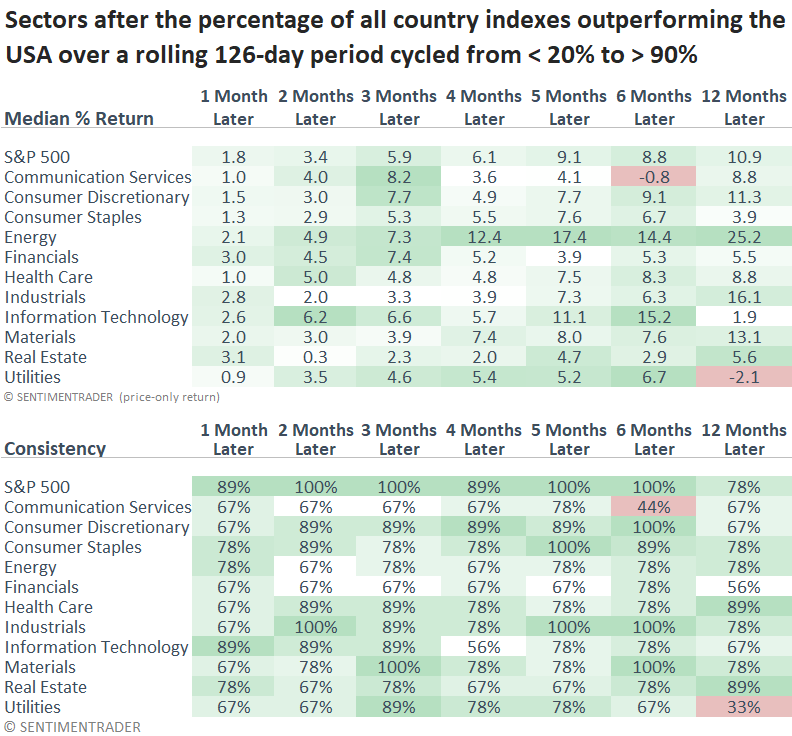
If I apply the signals to the S&P 500 and its sectors, offensive-oriented groups outpaced defensive-minded ones. That was especially the case for technology in the initial six months, reinforcing findings from other recent reports pointing to where opportunities may lie. 

Historically, when a significant proportion of countries outperform the U.S. over six months, it hasn't led to sustained global leadership. The MSCI World Index generally underperformed the S&P 500 over the next one to five months, and even the mild advantage from six to twelve months wasn't particularly compelling. 

What the research tells us...

Despite recent outperformance and attractive valuations, the narrative of a "great rotation" into global equities appears more like a head fake than a durable shift. While I have my views, I defer to the data, and the market's message takes precedence. Historically, when global equities have outperformed the U.S. as sharply as they have over the past six months, it has generally been a positive signal for stocks across the globe. However, this hasn't translated into sustained international leadership compared to the S&P 500. For now, a home country (U.S.) bias is advisable with a tilt toward cyclicals, especially technology.

PRODUCTS
SentimenTrader
Trading Tools
Indicators & Data API
‍
Strategies & Scanner
‍
Research Reports
FREE
RESOUrCES
Simple Backtest
Calculator
Simple Seasonality
Calculator
The Kelly Criterion
Calculator
Sentiment Geo Map
‍
Public Research Reports
‍
Education
Sentiment Indicators
‍
Technical Indicators
‍
Pricing
Bundle pricing
‍
FAQ
‍
Announcements
‍
COMPANY
‍
About
‍
In the News
‍
Testimonials
‍
Client Success Stories
CONTACT
‍
General Inquiries
‍
Media Inquiries
‍
Financial Professionals Inquiries
‍
© 2026 Sundial Capital Research Inc. All rights reserved.
Setsail Marketing
TermsPrivacyAffiliate Program
Risk Disclosure: The information and tools provided are for research and analytical purposes only and are not intended as investment advice. Market analysis involves uncertainty, and outcomes may differ from expectations. Users should conduct their own due diligence and consider their individual circumstances before making any financial decisions. Past performance is not necessarily indicative of future results.

Hypothetical Performance Disclosure: Hypothetical performance results have many inherent limitations, some of which are described below. No representation is being made that any account will or is likely to achieve profits or losses similar to those shown; in fact, there are frequently sharp differences between hypothetical performance results and the actual results subsequently achieved by any particular trading program. One of the limitations of hypothetical performance results is that they are generally prepared with the benefit of hindsight. In addition, hypothetical trading does not involve financial risk, and no hypothetical trading record can completely account for the impact of financial risk of actual trading. for example, the ability to withstand losses or to adhere to a particular trading program in spite of trading losses are material points which can also adversely affect actual trading results. There are numerous other factors related to the markets in general or to the implementation of any specific trading program which cannot be fully accounted for in the preparation of hypothetical performance results and all which can adversely affect trading results.

Testimonial Disclosure: Testimonials appearing on this website may not be representative of other clients or customers and is not a guarantee of future performance or success.