
Our New Historical Volatility Indicator

Key points:
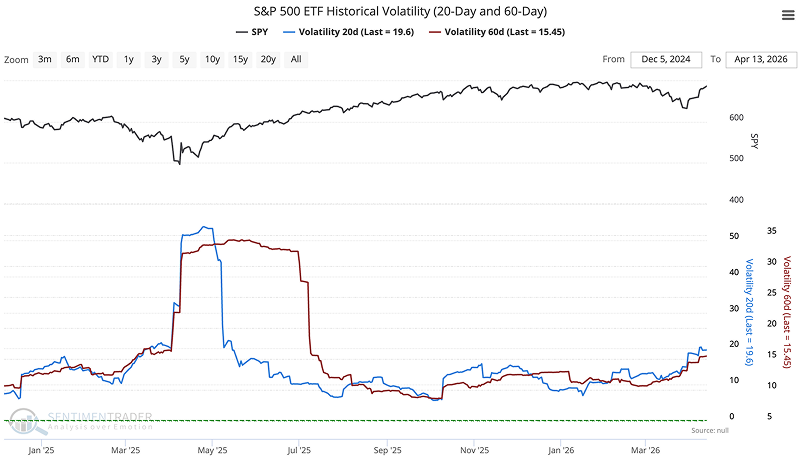
- Traders can now measure true market turbulence with our new Historical Volatility indicators, built on daily log returns.
- These metrics cover both short-term and medium-term historical volatility.
- Users can now seamlessly build custom composite indicators using these new volatility metrics.
A New Perspective on Volatility
Why log returns? Because they normalize price changes across different price levels a 10 move on a 100 stock differs from a 10 move on a 1000 stock. Assuming Pt is the latest daily closing price, the daily log return Rt is expressed as:
Rt = ln(Pt / Pt-1)
Once we have a continuous series of returns, we calculate the sample standard deviation σ over a specific time window N (for this tool, we mainly focus on 20-day and 60-day periods). This step measures how wildly actual returns are deviating from their average, represented mathematically as:
σ = √[ 1/(N-1) ∑(Ri - Ravg)2 ]
Here, Ravg represents the average return within that specific window. Finally, since there are roughly 252 tradin