
Other Indicators Beneath the V-Shaped Bottom

Key Takeaways:
- Liquidity, market breadth, and sentiment indicators have all experienced a rapid recovery.
- Markets have performed well following these specific signals.
- Markets often need to go through a period of consolidation to digest such a shift.
Following the Momentum of Market Indicators
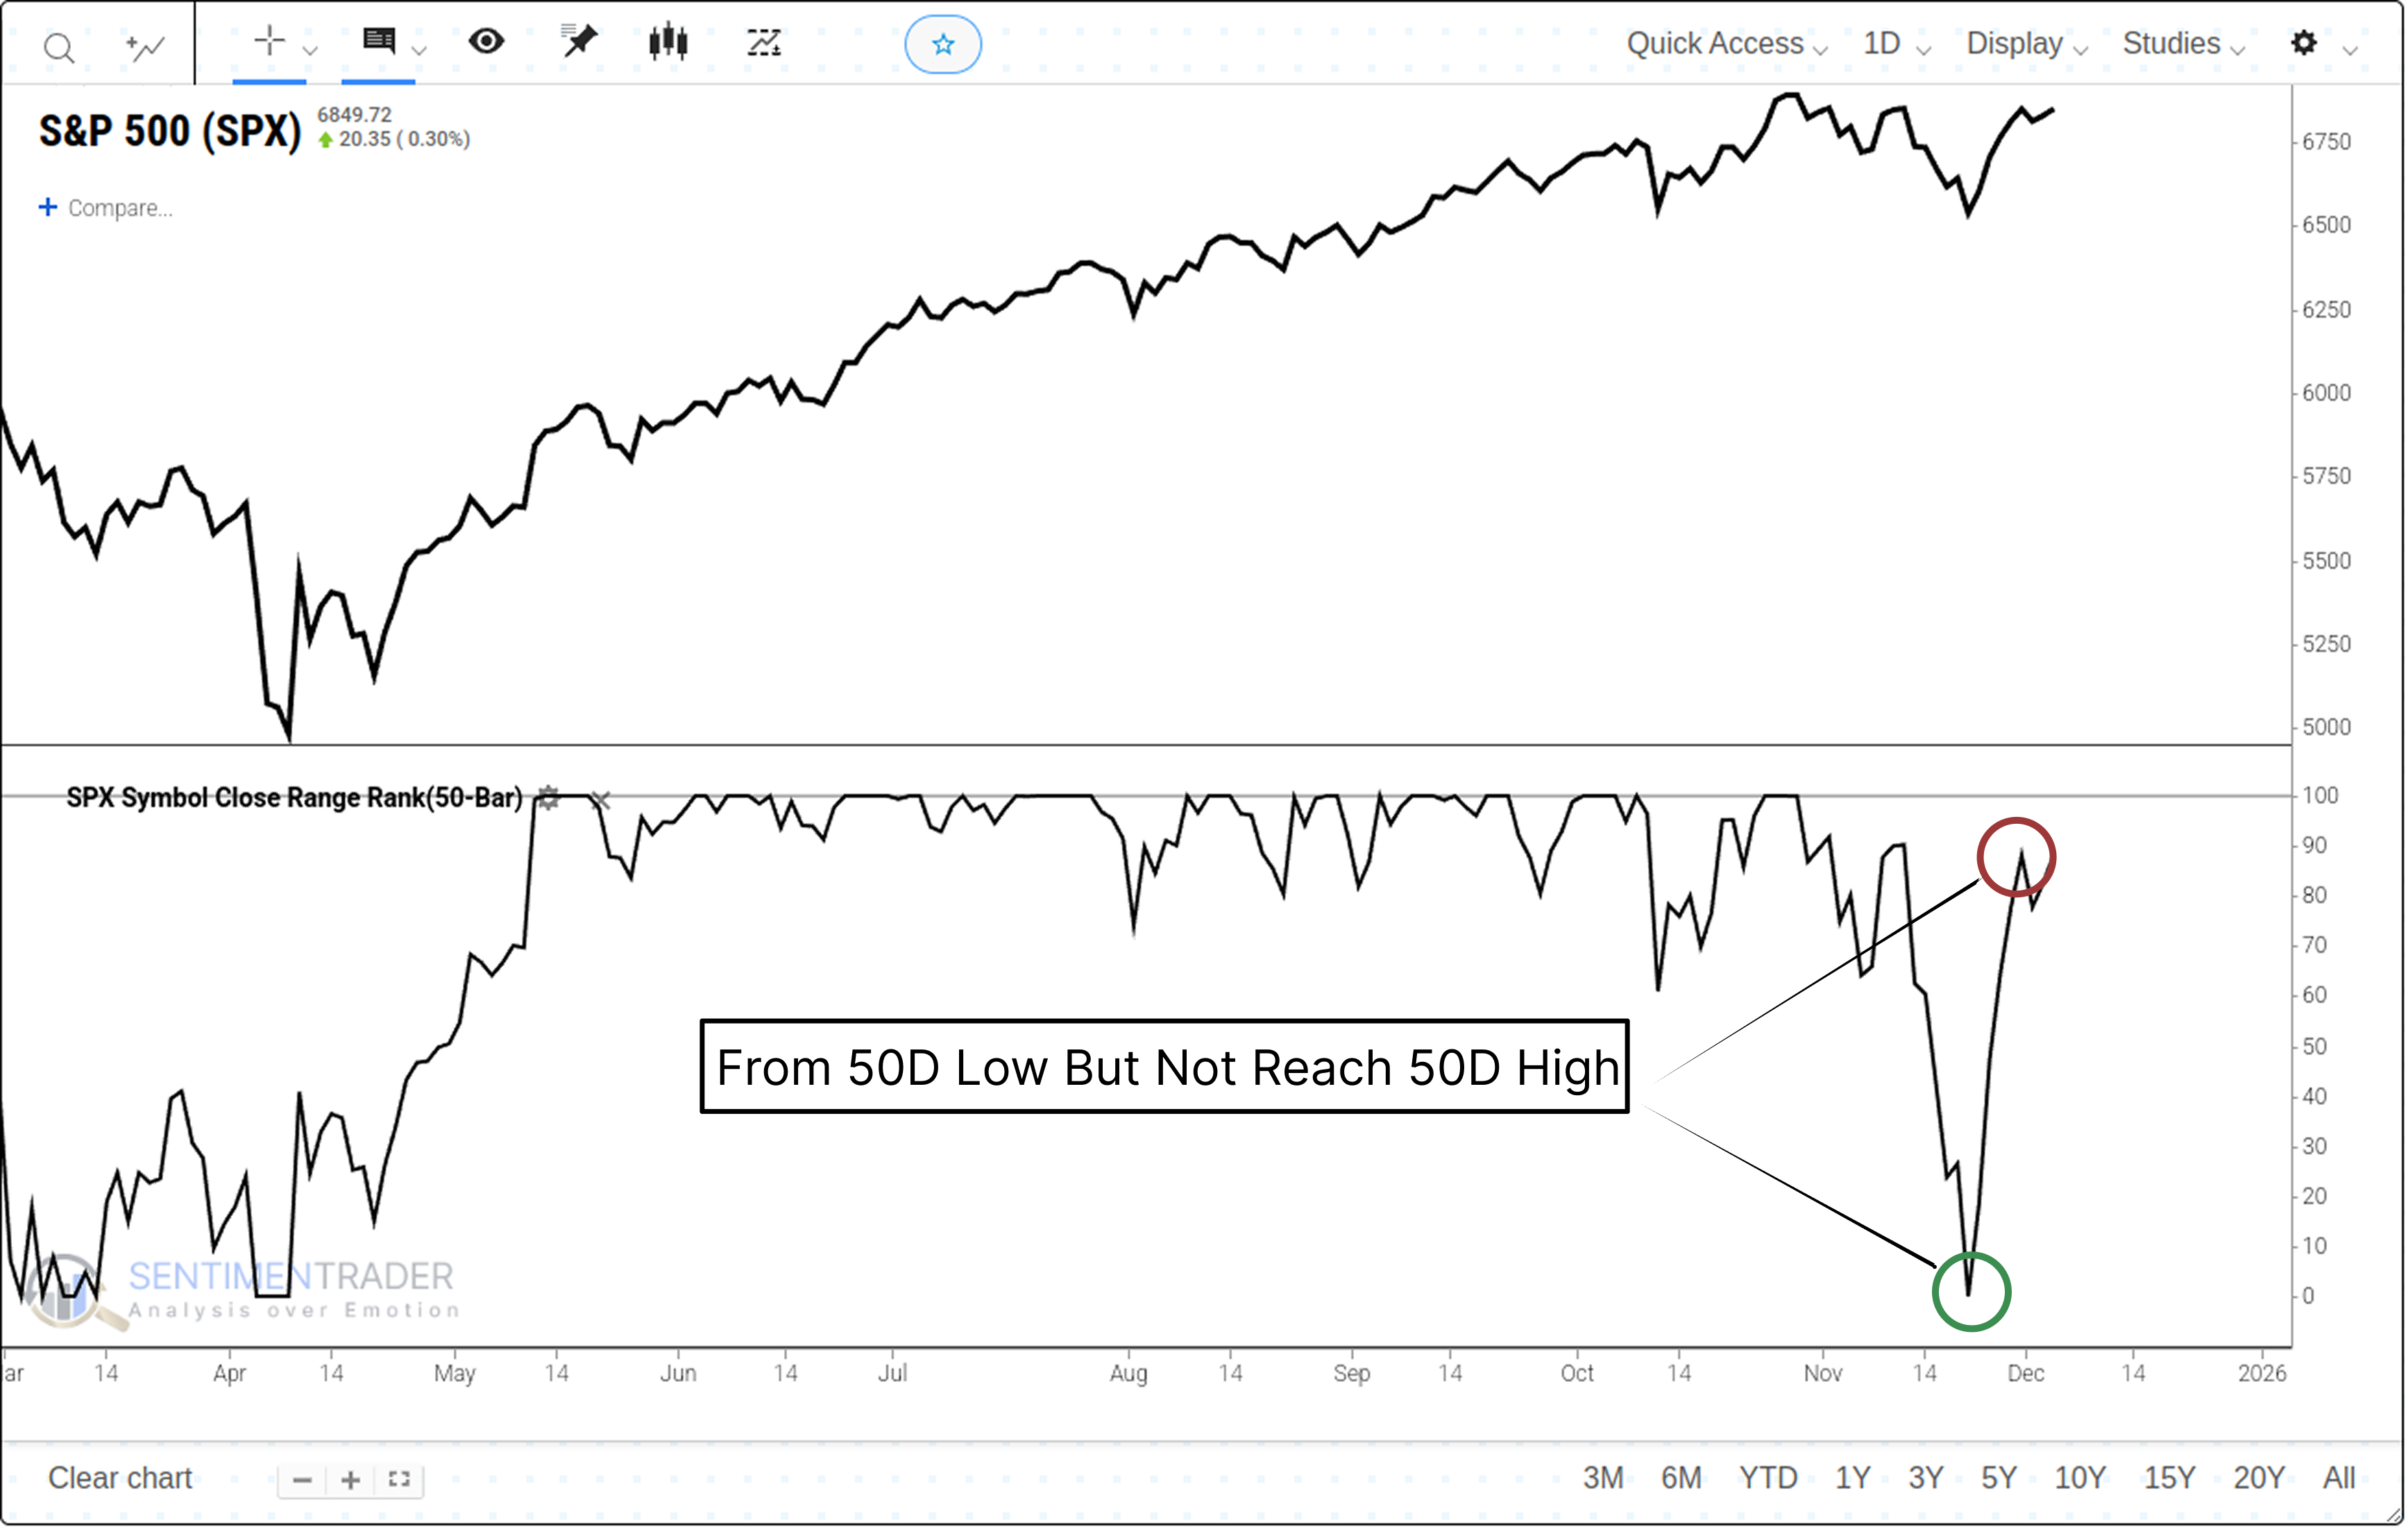
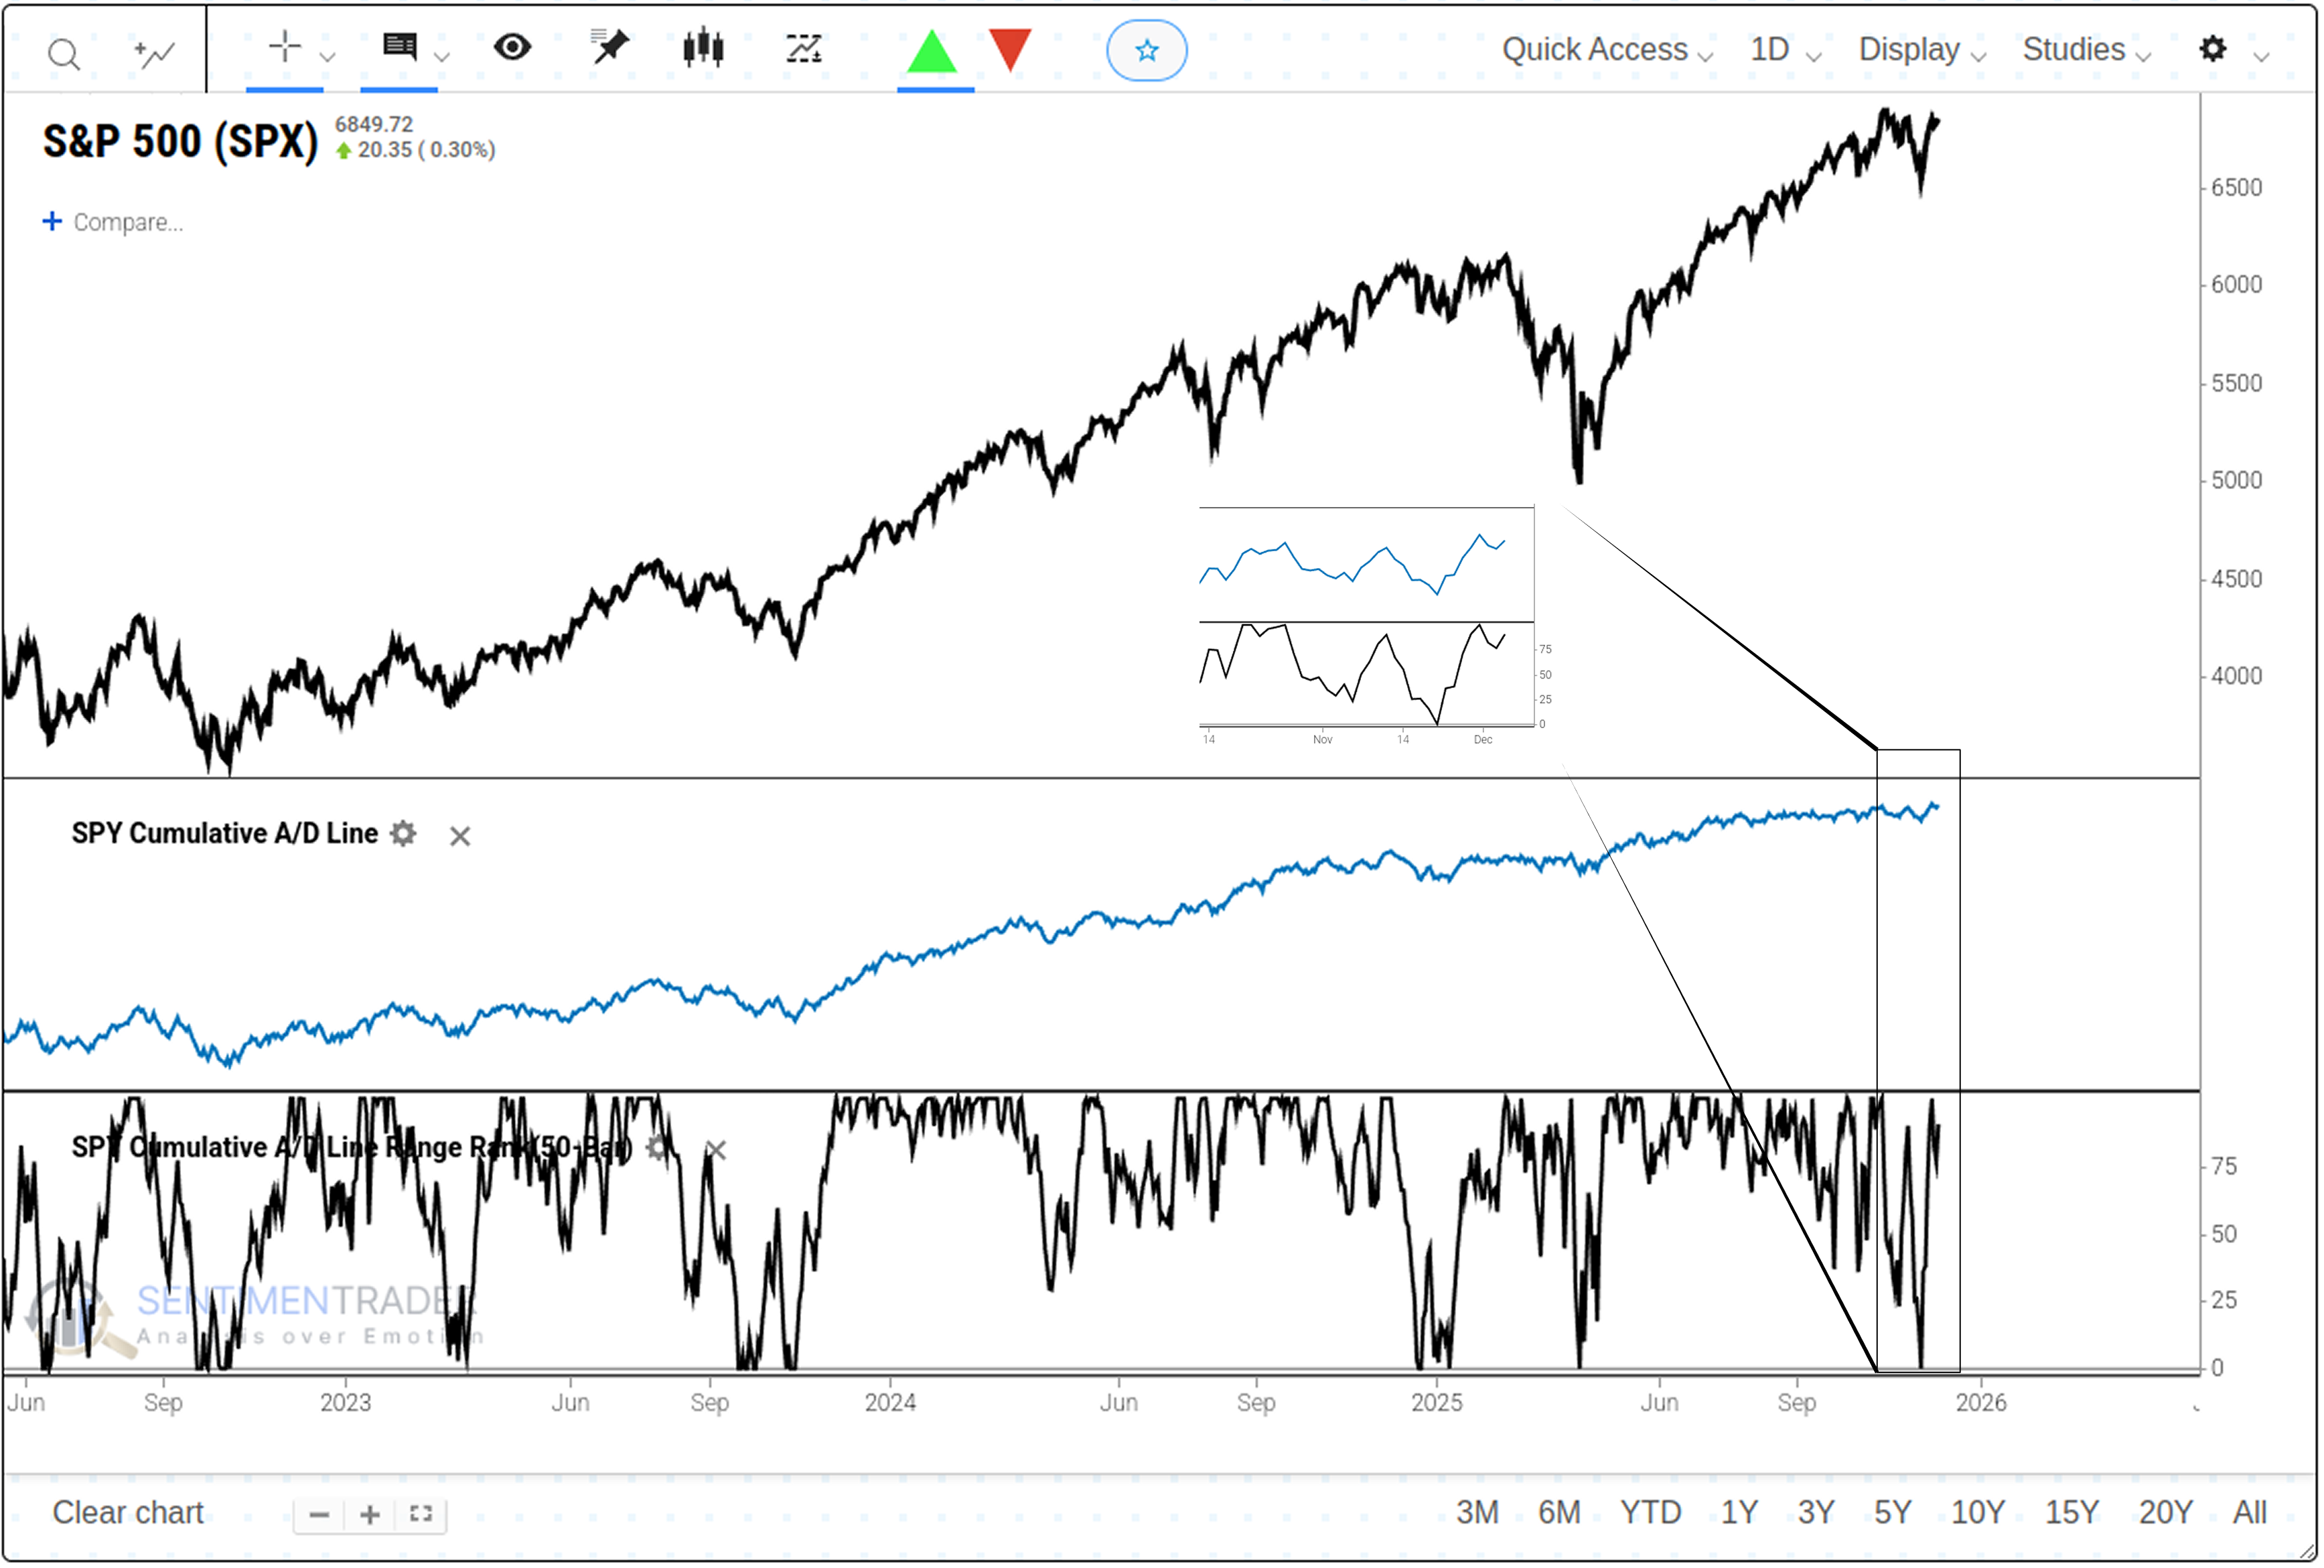
If we only observe the market through the price chart of the S&P 500 index, the current recovery appears somewhat hesitant. While the index has rebounded from its 50-day low, it has not rallied to a 50-day high within 10 trading days as rapidly as in some historical periods to reach a historically strong level.
Shifting our perspective away from the market's price action and toward related market indicators-including liquidity conditions, market breadth, and investor sentiment-reveals additional insights about the current market environment.
Notably, improvements in these indicators represent the accumulation of "internal momentum," yet such divergences may still fail without the final confirmation of a price breakout. Therefore, these readings are not a crystal ball for predicting the future, but rather a record of market conditions over the past few weeks.
Market Liquidity Conditions
During the previous market pullback, the ETF capital market stress indicator soared, signaling growing fears of liquidity depletion. Our SPY Liquidity Premium indicator quickly breached the 0.25 level. Within just 10 trading days, the indicator fell from above 0.25 to below 0.10.
This rapid shift in the indicator is typically a characteristic of V-shaped bottoms. Historically, the quick dissipation of such pressure has been accompanied by asset price recovery.Related Backtest Click Here.
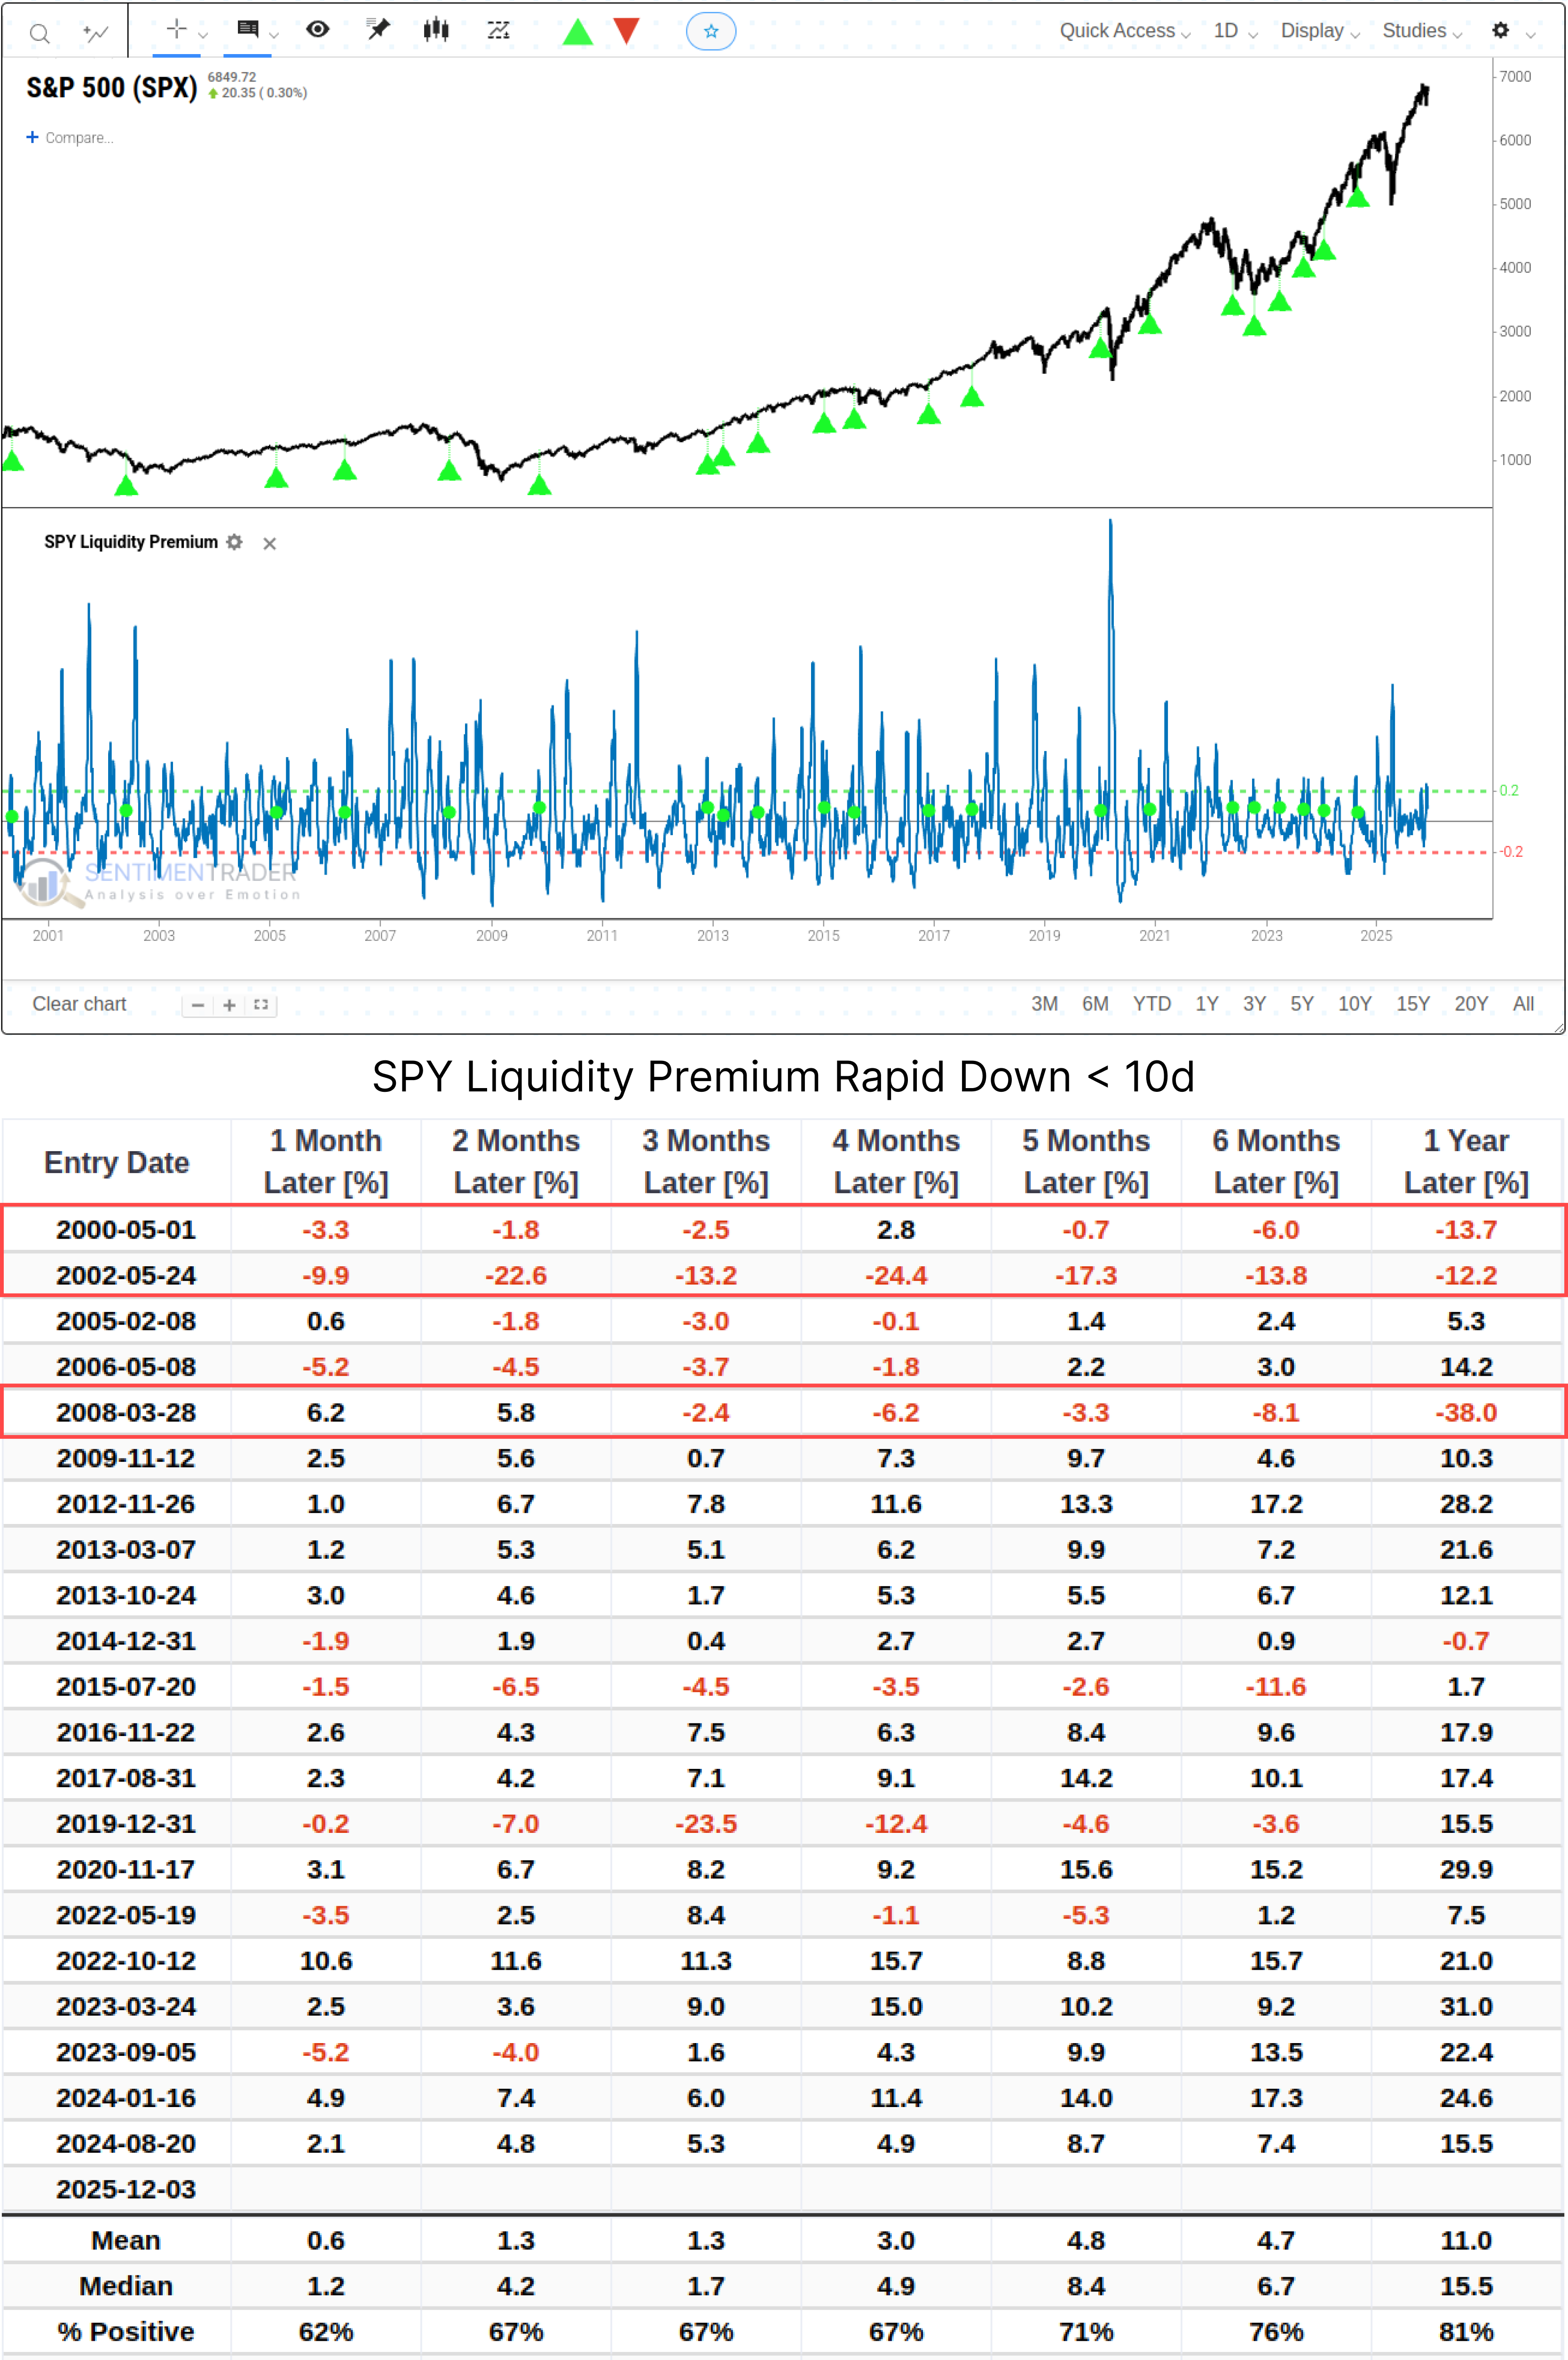
Following similar signals, the S&P 500 index has an 81% probability of rising over the subsequent year, with an average return of +11%. It must be noted that this signal failed during structural bear markets such as 2000, 2002, and 2008. As such, it reflects the easing of current panic sentiment rather than a reversal in economic fundamentals. Once the macro environment deteriorates, liquidity improvement alone is insufficient to sustain a bull market.
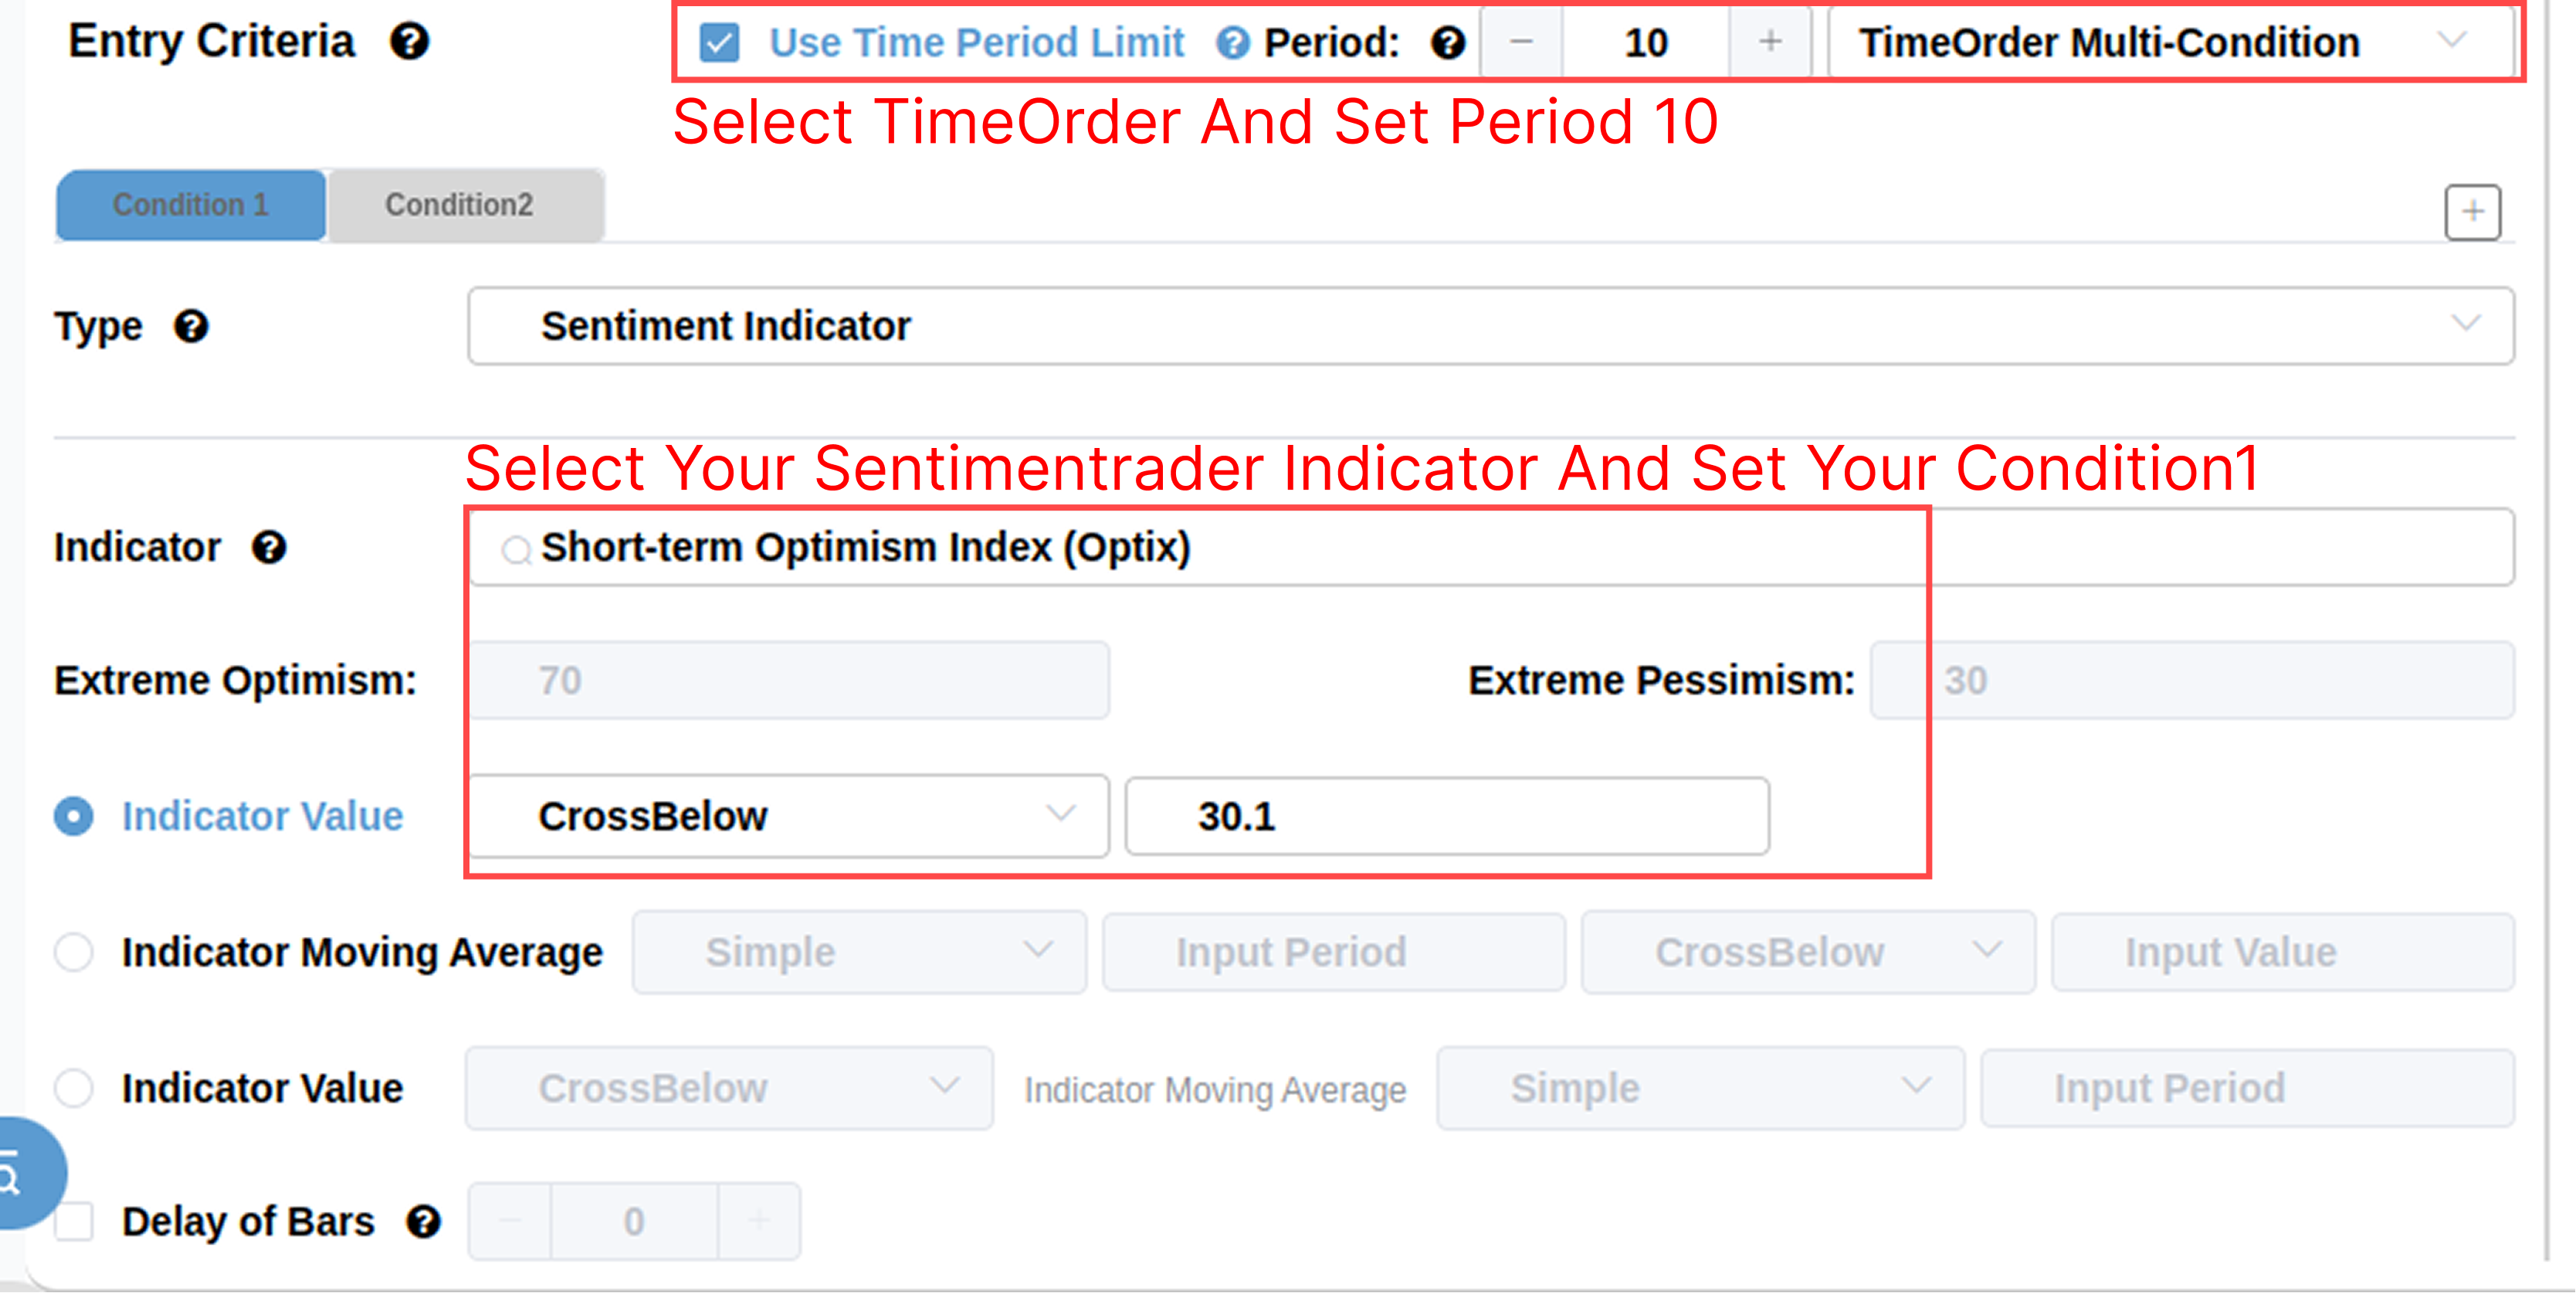
The following backtests can all be created in a similar manner by following these steps:
Rebound in Breadth Indicators
Another notable observation comes from the behavior of the SPY Cumulative A/D Line. This indicator reversed from a 50-day low (0%) to a 50-day high (100%) in an extremely short window. This represents a shift among market participants from "widespread selling" to "panic buying."
When we narrow the observation window to 10 days:Related Backtest Click Here.
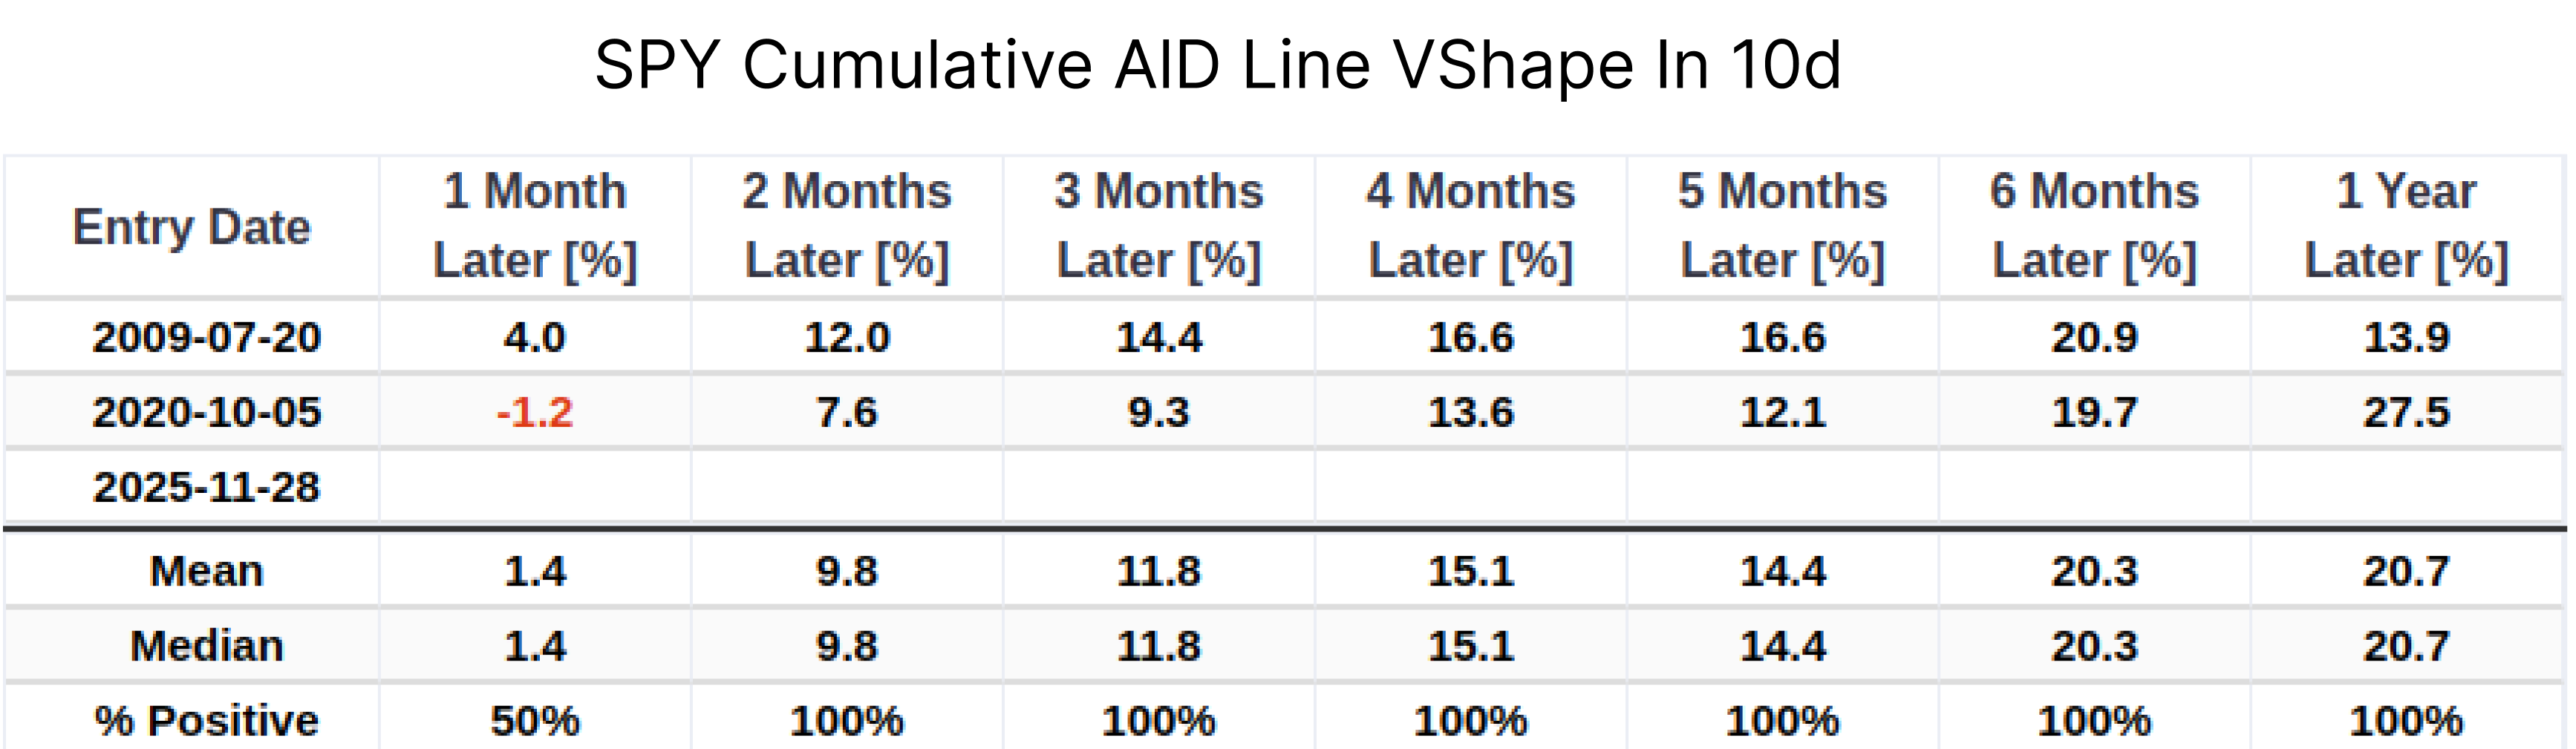
This extreme V-shaped reversal has occurred only three times: July 2009, October 2020, and now. The scarcity of such extreme samples means this conclusion lacks statistical significance and serves more as a reference point for the market being in a specific state.
Expanding the time window to one month, historical records show strong positive expectations:Related Backtest Click Here.
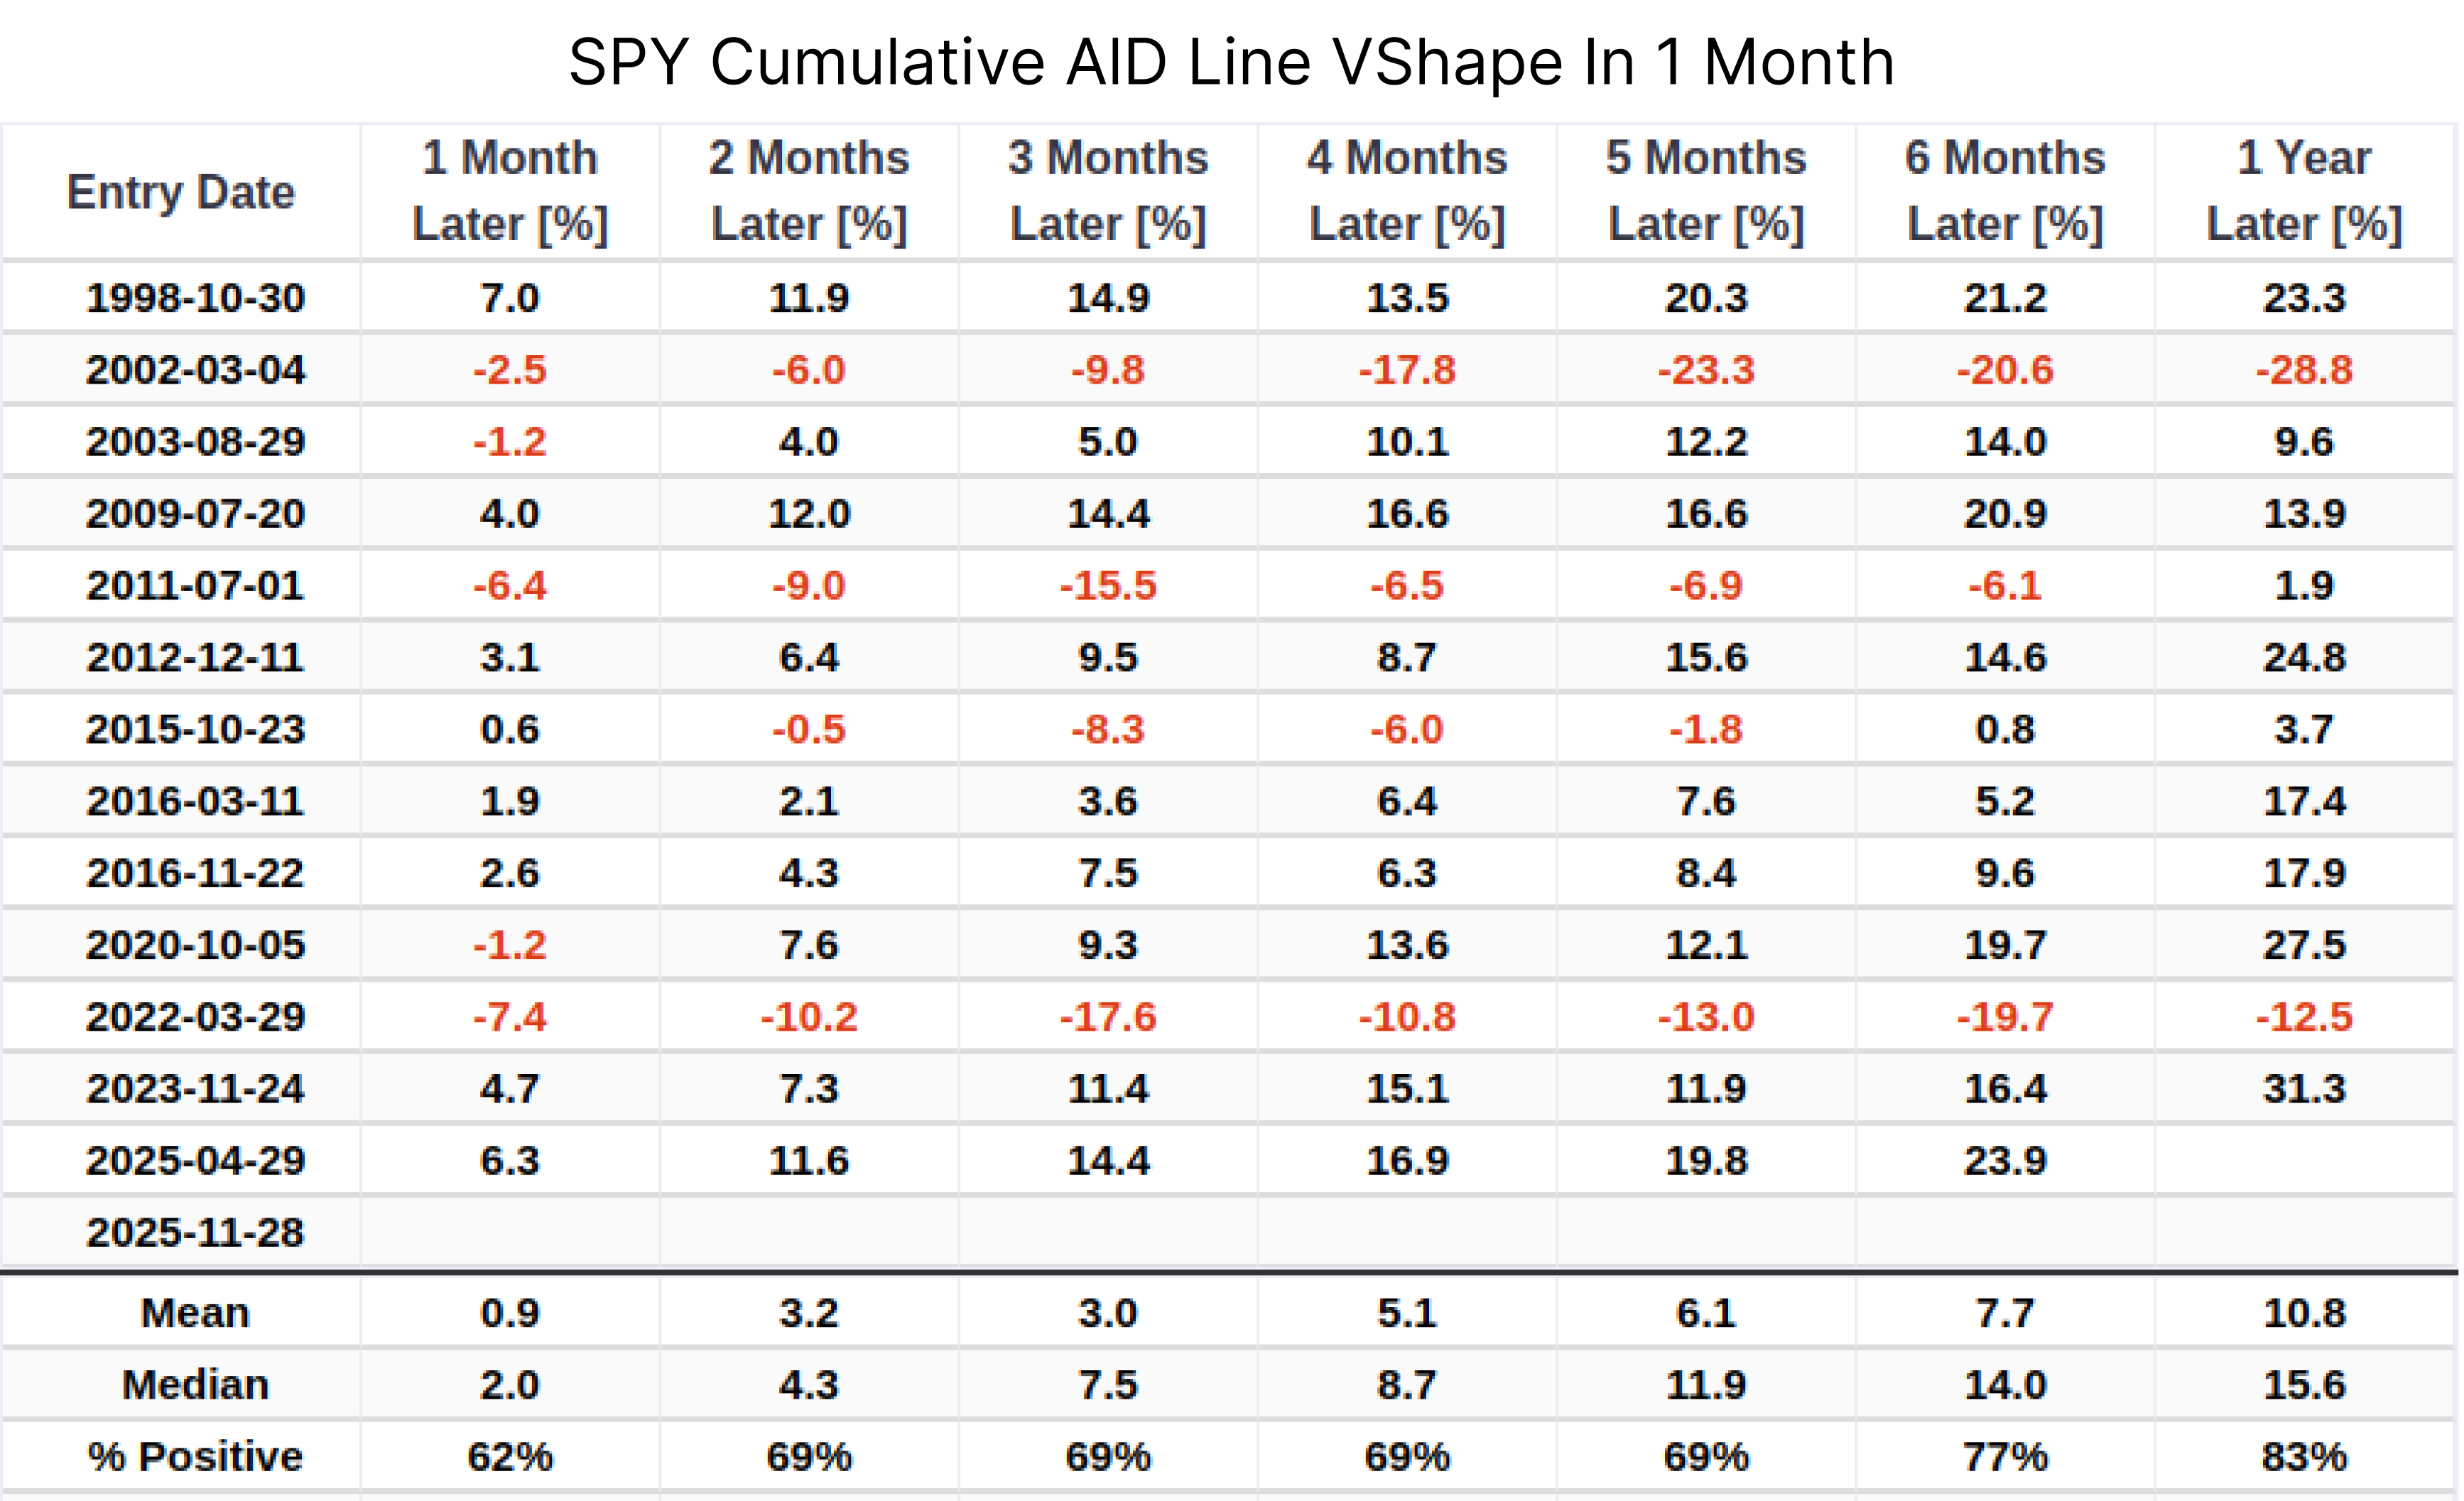
Among the 13 similar historical signals, the S&P 500 had an 83% probability of rising over the subsequent year.
Swing in Sentiment
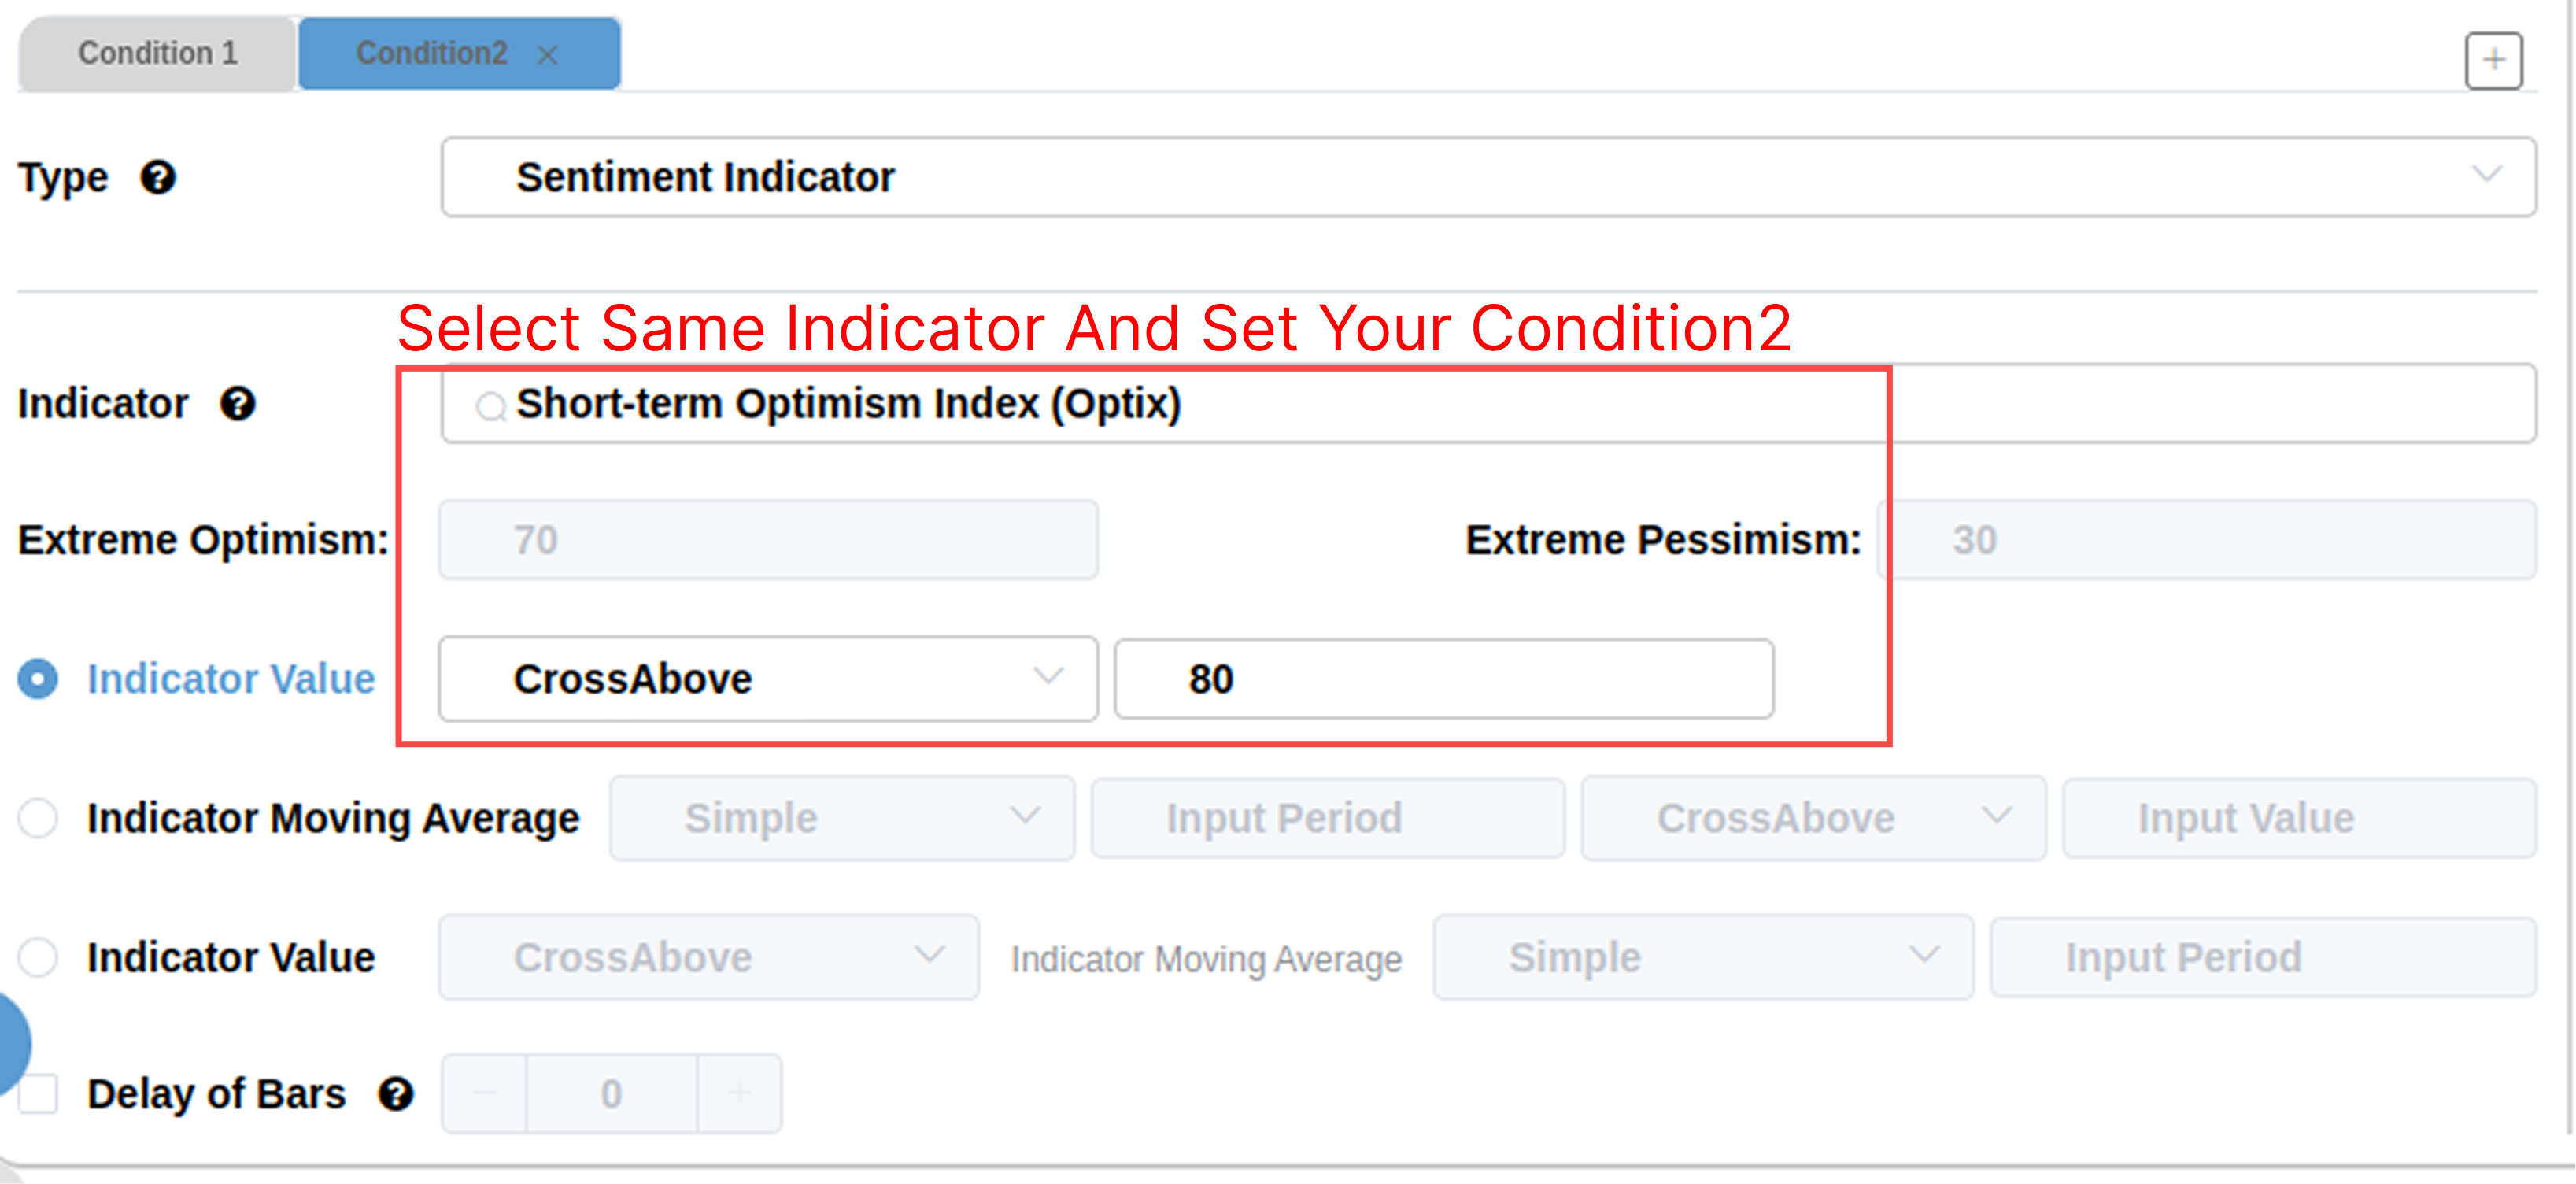
Investor sentiment indicators also document this dramatic psychological rollercoaster. The Short-term Optimism Index (Optix) experienced a sharp whipsaw, reversing from extreme pessimism (<30.1) to extreme optimism (>80) in just 10 days.
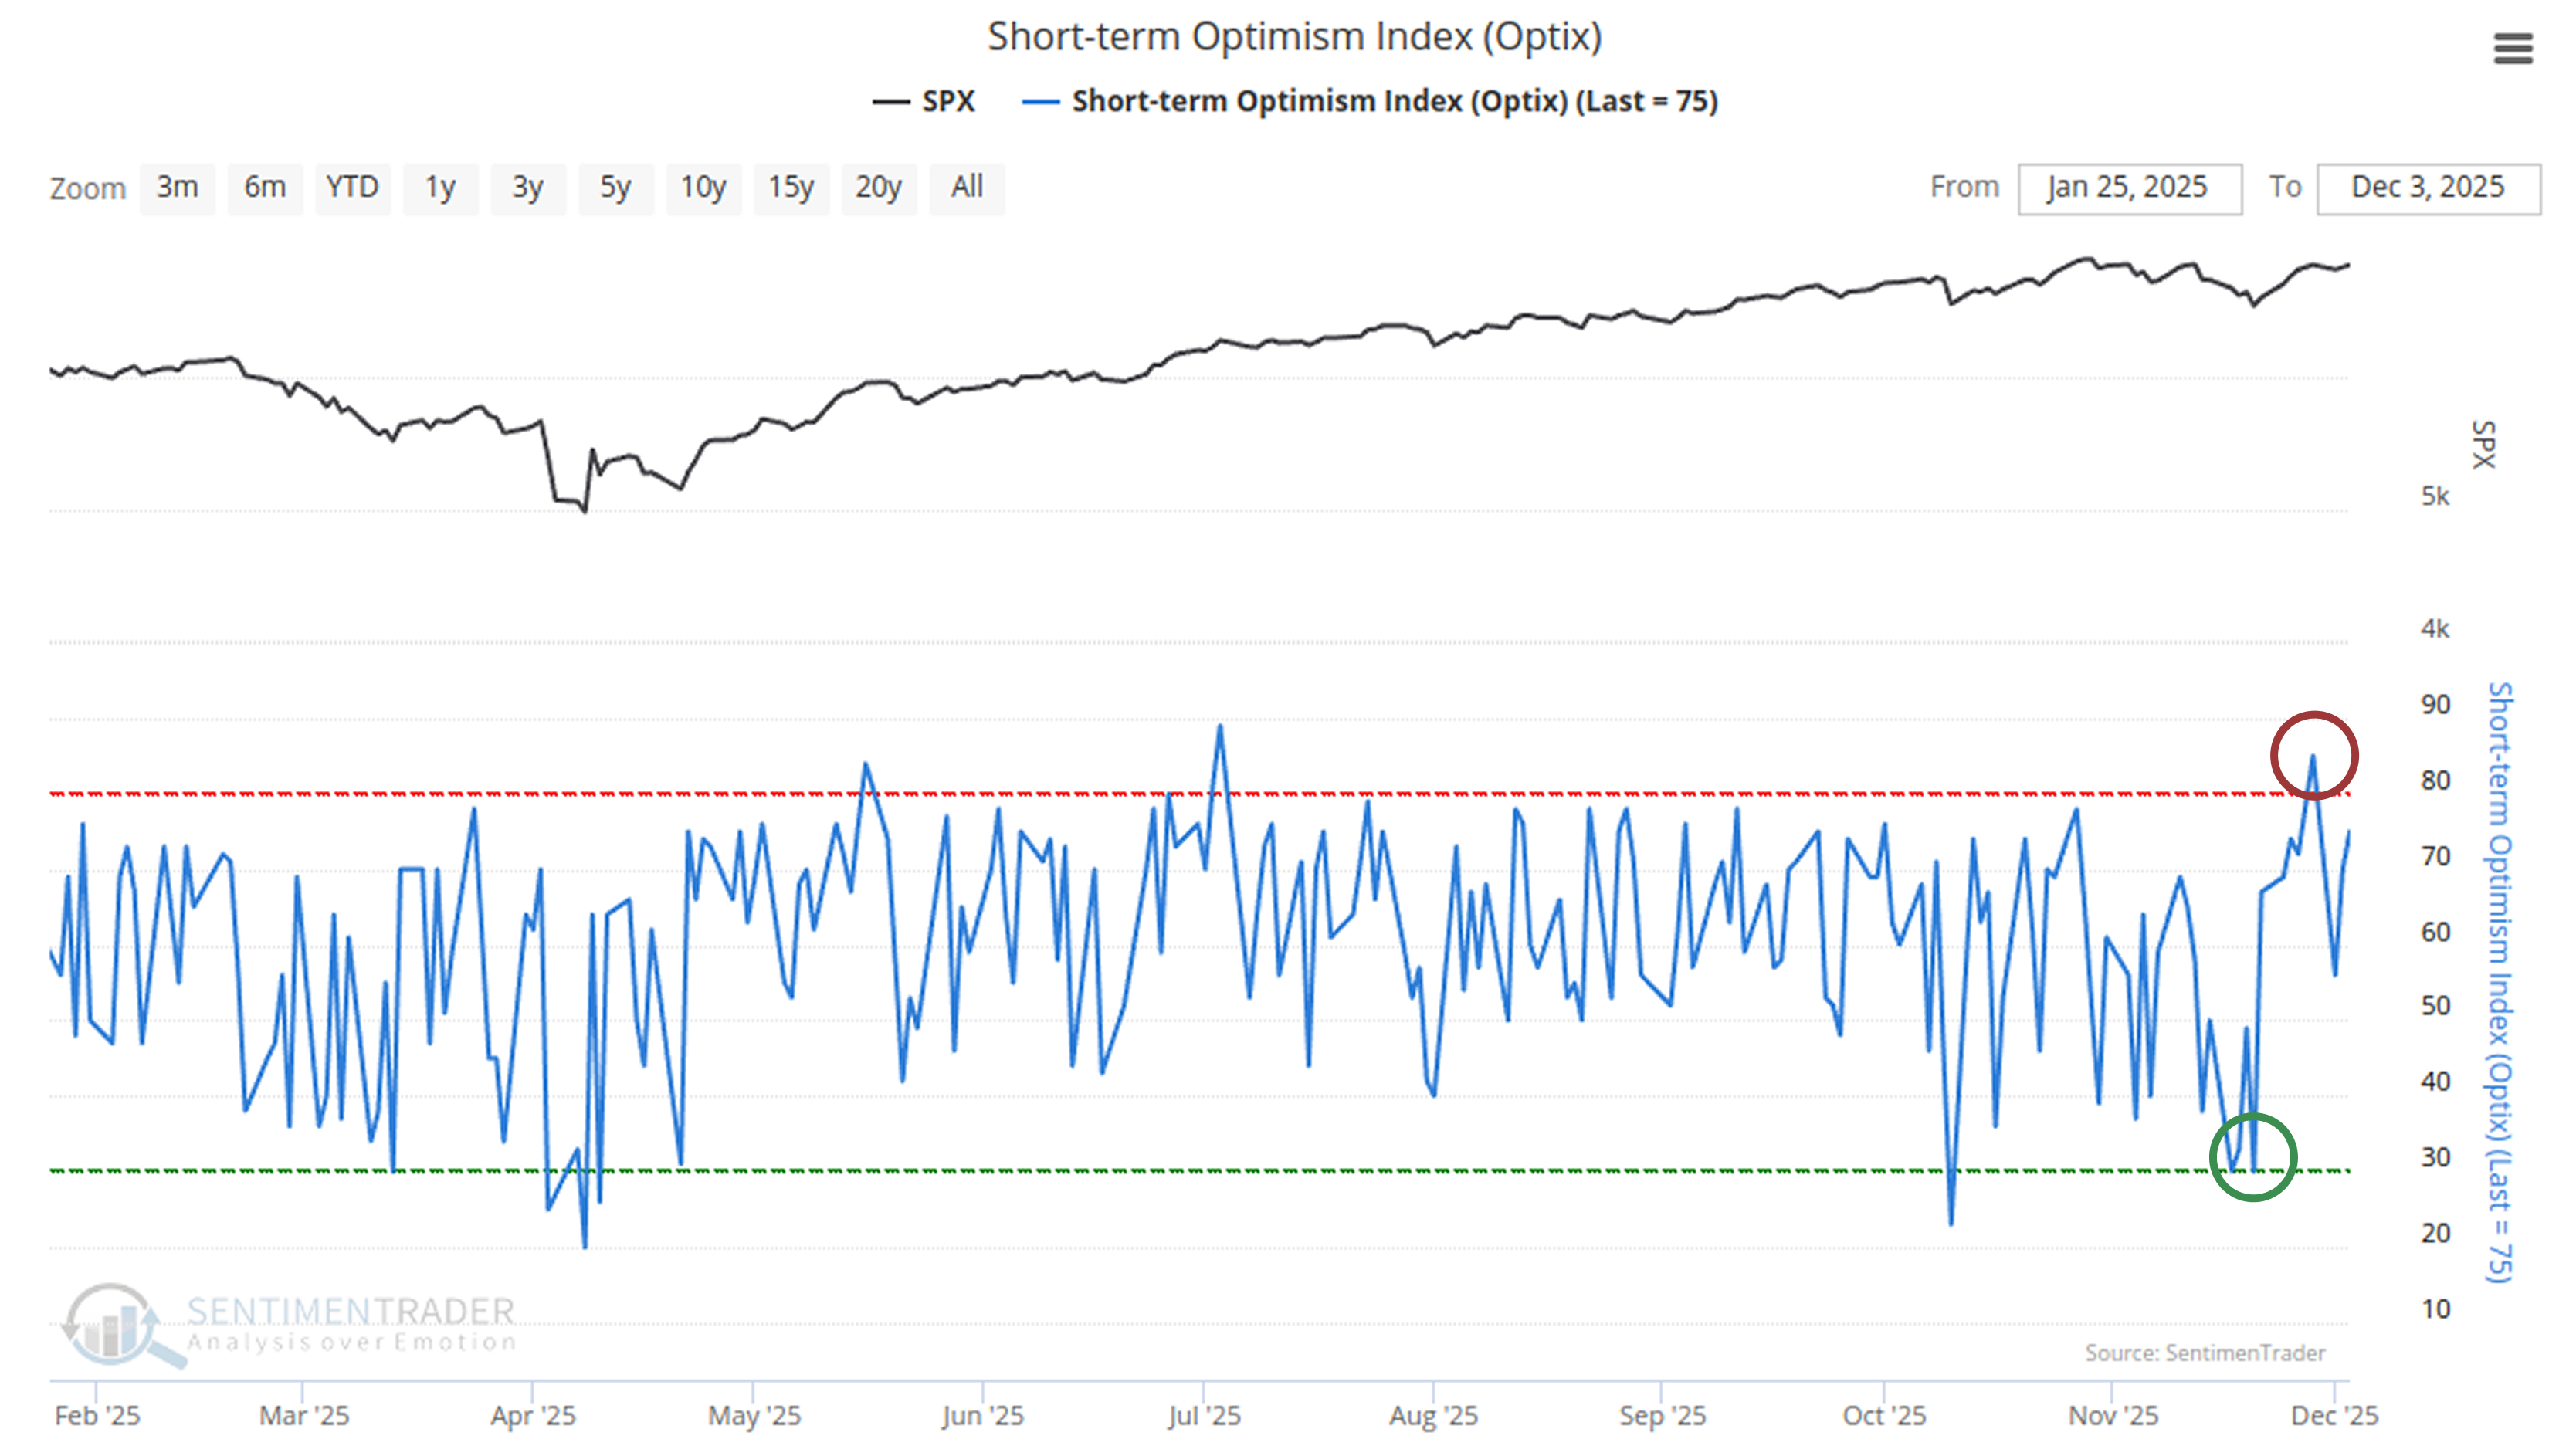
These thresholds are merely an observed phenomenon today, not a holy grail signal. Collectively, however, the recorded fact is that market sentiment completed a swing from pessimism to optimism in an extremely short period.Related Backtest Click Here.
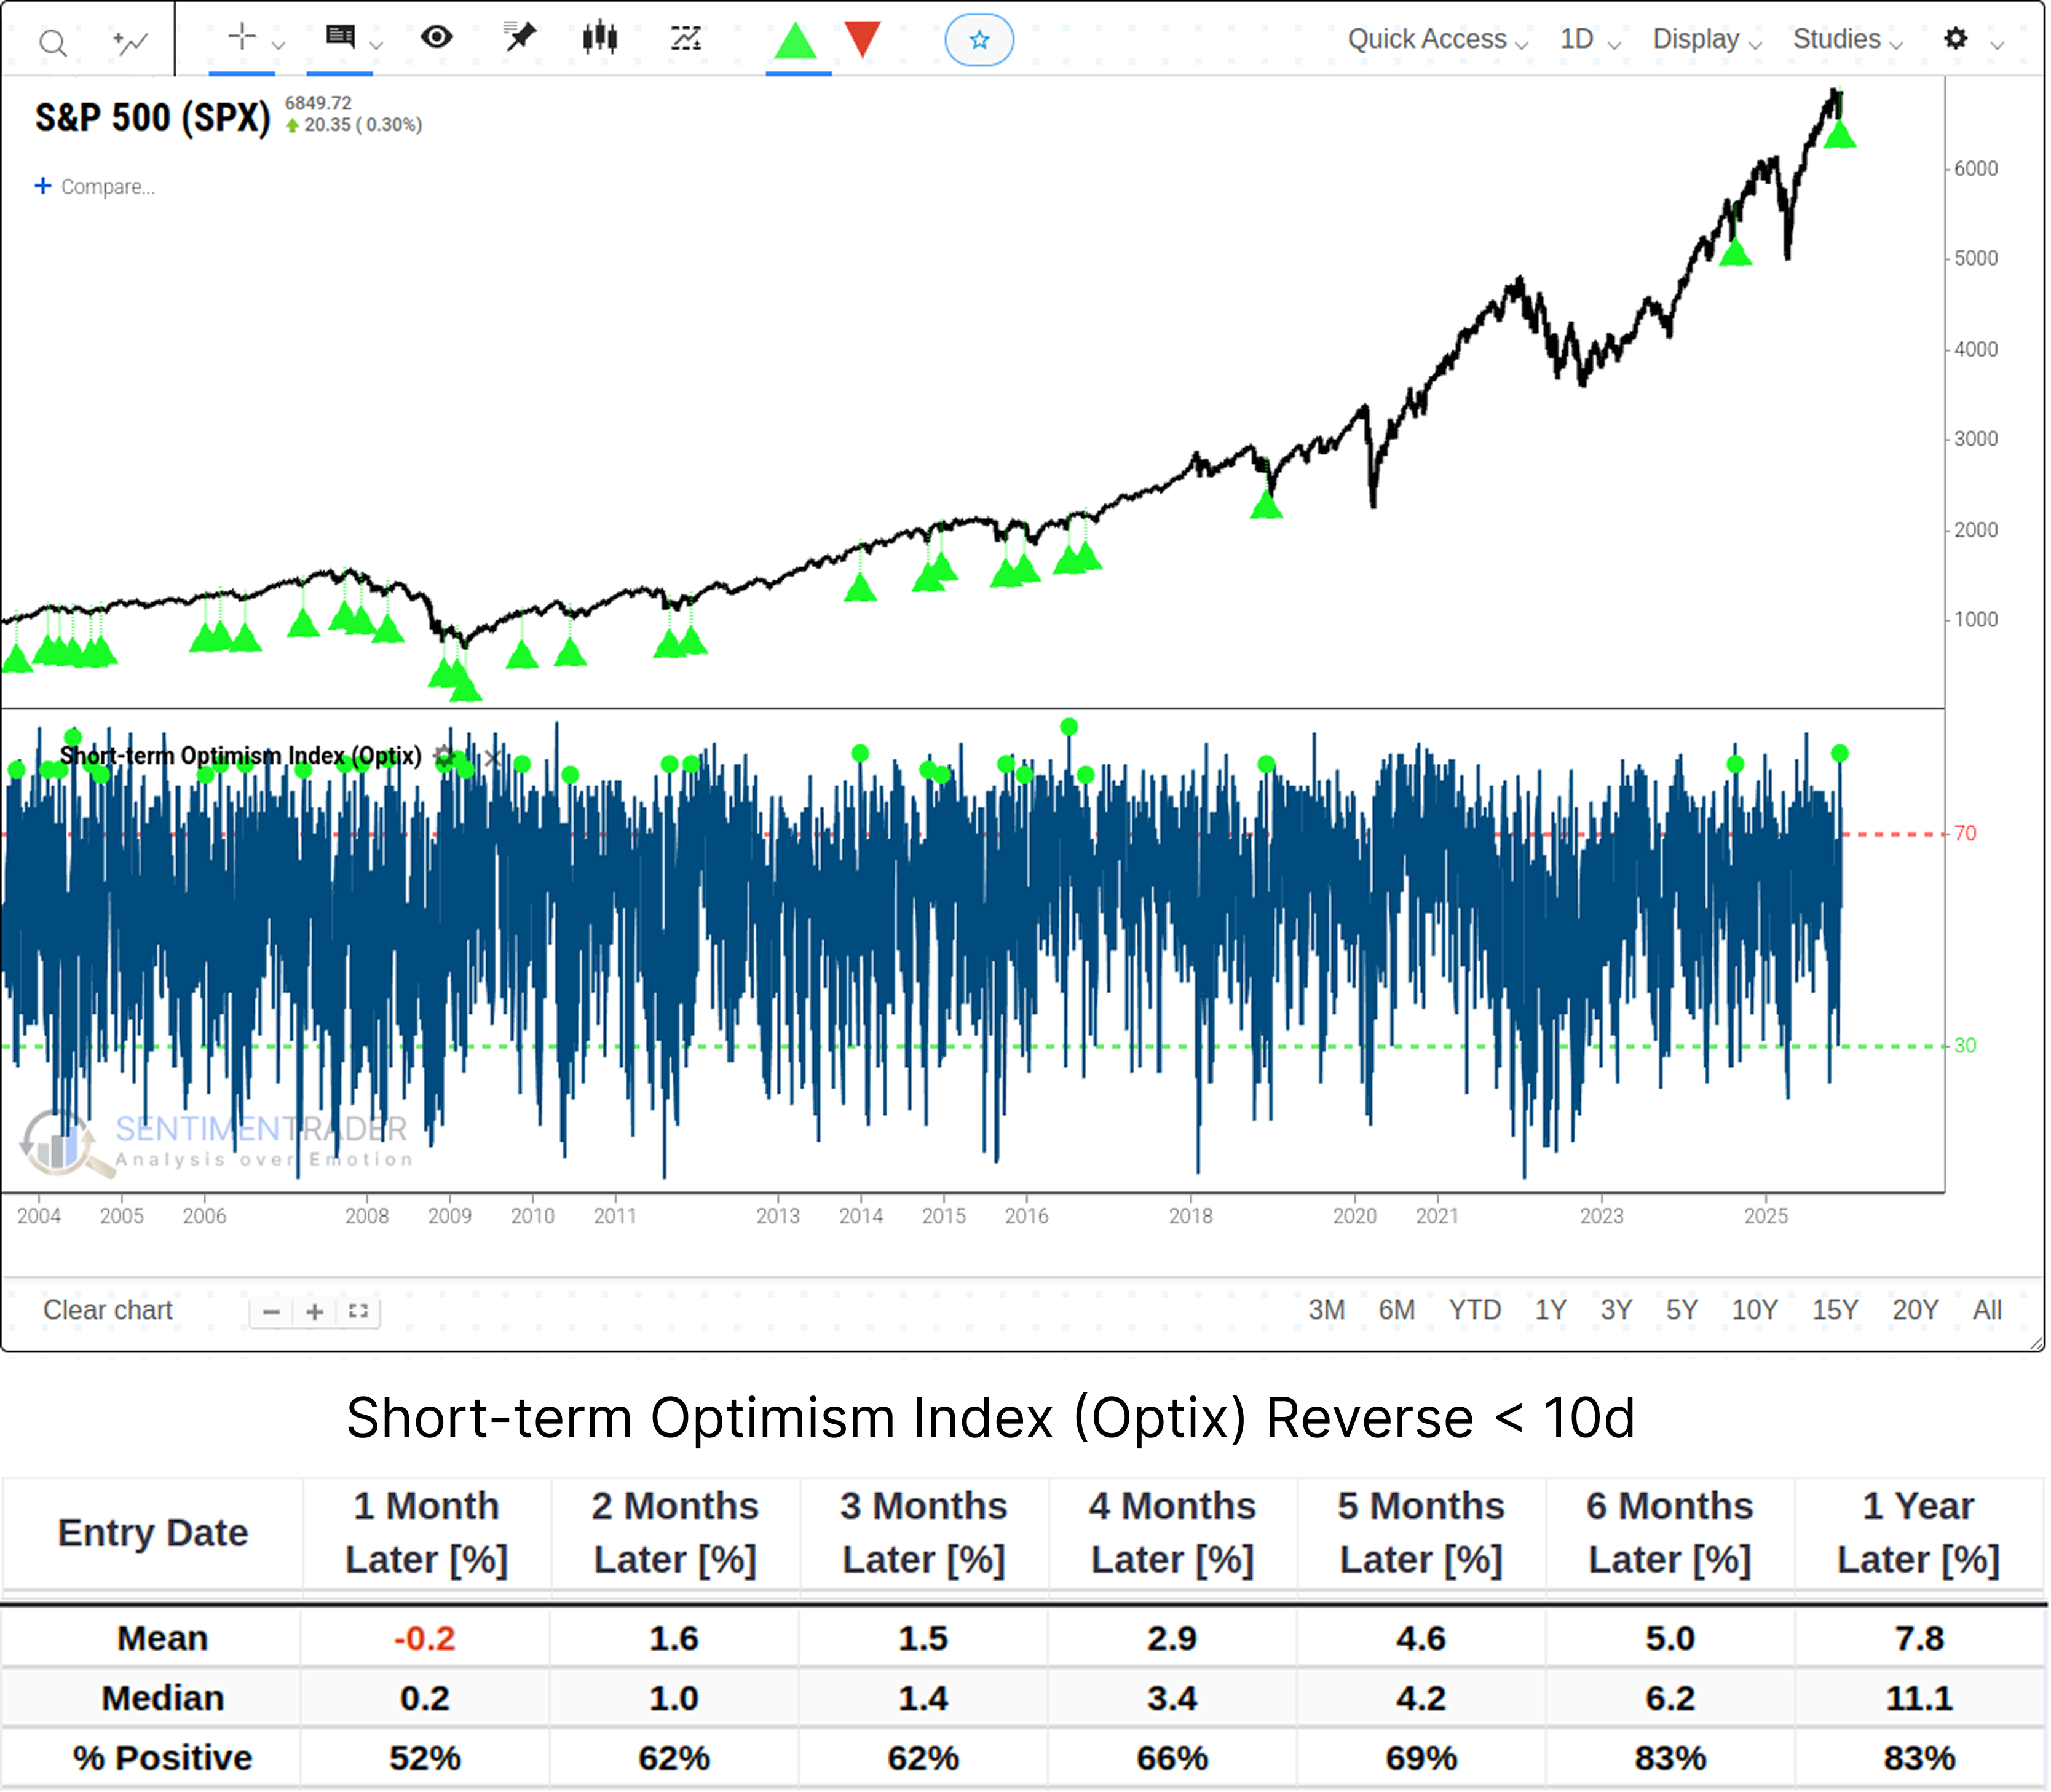
Meanwhile, the 30 total historical signals indicate that markets in such conditions tend to pull back in the short term.
At the same time, the NYSE's NYSE High/Low Ratio exhibited similar behavior, swiftly shifting from being dominated by new lows (<0.2) to new highs (>0.9). This sharp expansion in breadth is commonly described as a "breadth thrust."Related Backtest Click Here.
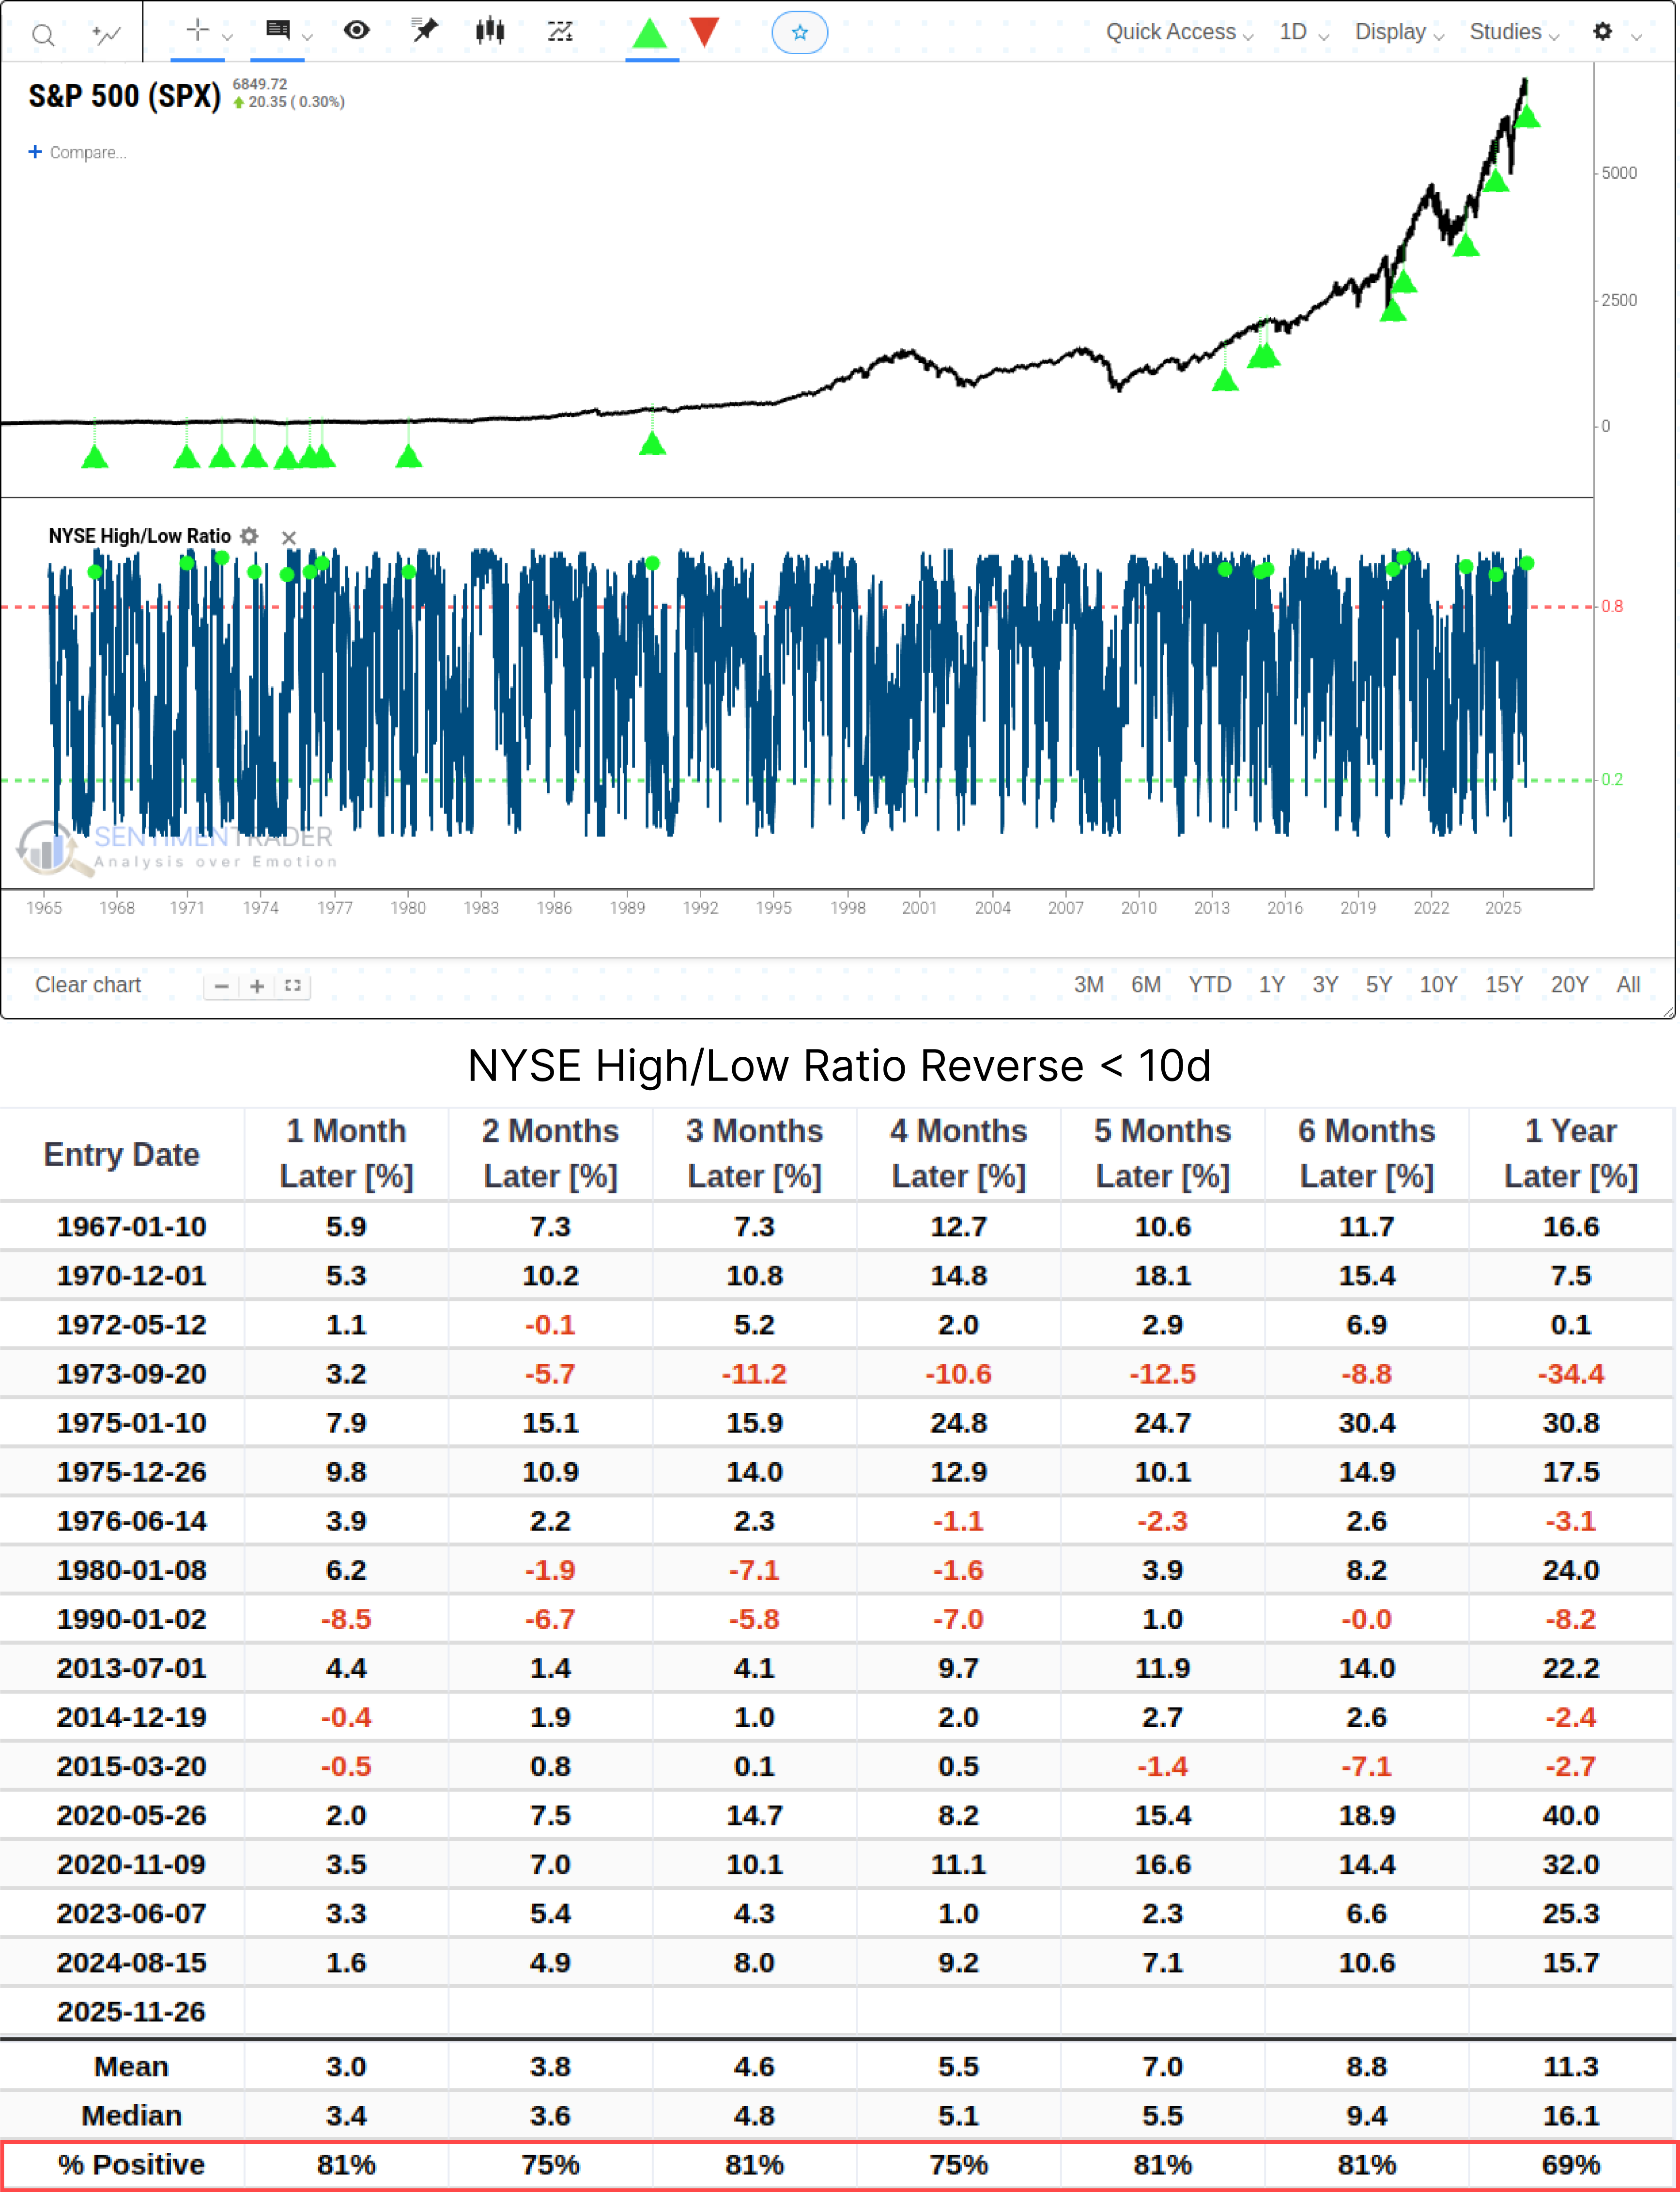
Historical data shows that the market has an 81% probability of rising over the subsequent six months, with an average return of nearly 9%-a reflection of the inertia that momentum tends to have once established.
What the Research Tells Us...
Data reveals that the market's internal structure has undergone a "reset." While such resets have historically aligned with the formation of market bottoms, the scarcity of samples and the specific recent patterns of these indicators mean we should not simply equate this to a "buy signal." More accurately, the market's Risk/Reward Profile has changed significantly compared to a few weeks ago.
For investors, this observation helps explain that the current market rebound is not unfounded, but also reminds us that high historical win rates do not rule out the possibility of "fake moves" or another pullback in the short term. The most pragmatic strategy is to view these internal signals as evidence of an improved market backdrop, rather than a reason to blindly add leverage.