Products
SentimenTrader Trading Tools
‍
Backtest Engine
My Trading Toolkit
Correlation Analysis
Seasonality
Market Prediction
Indicators & Data API
‍
Proprietary Indicators & Charts
Market Data API
Strategies & Scanner
‍
50+ Trading Strategies
Smart Stock Scanner
Smart Option Scanner
Research Reports
‍
Research Solutions
Reports Library
Free Resources
Simple Backtest Calculator
Simple Seasonality Calculator
The Kelly Criterion Calculator
Sentiment Geo Map
Public Research Reports
Education
Sentiment Indicators
Technical Indicators
Pricing
Company
About
In the News
Testimonials
Client Success Stories
Contact
Log inLoginSign up
< BACK TO ALL REPORTS

Options Traders Are Leveraged After A Good Year-End

Jason Goepfert
2020-01-03
After a good end to the year, stocks often struggle, and options traders are leveraged and bullish, with the U.S. dollar breaking down

Starts after a great year

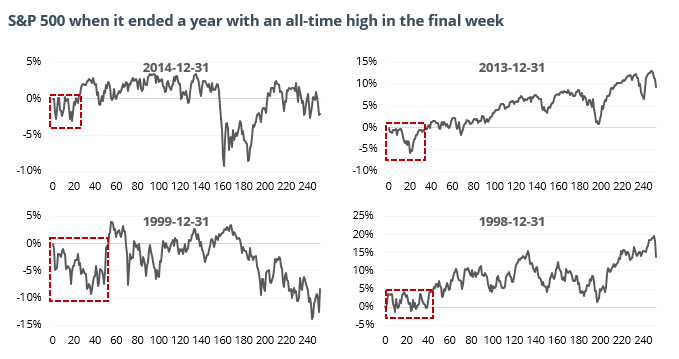
The most widely bench-marked indexes in the world closed last year at or near record highs. When that has happened, almost always stocks see choppy trading during the first couple of months of a new year before taking off again.

Looking at an aggregate of 9 historical instances when the S&P 500 hit a record high in the last week of the year, the first 1-2 months of the New Year tended to see choppy or negative returns, including the last four times it happened.


Leveraged and aggressive

The greatest risk to stocks according to the various ways we look at it is not yet in the longer-term, but rather the short- to medium-term. Many of the indicators that we track are most effective over a 1-3 month time frame, and as noted last week, they are extremely stretched. 

Among the most egregious of the extremes are indicators that focus on leveraged products, such as options. The Options Speculation Index (OSI) shows that traders are focusing 30% more on bullish options strategies than bearish ones.

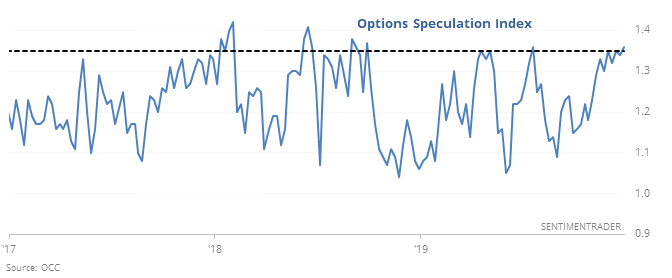
The OSI was persistently (and meaningfully) above 1.30 during many weeks in the year 2000. After that bubble burst, options traders didn’t gather this kind of courage for another 10 years, with the next reading not showing up until 2010. Since then, it has triggered a handful of times, leading to negative returns over the short- to medium-term for stocks.


U.S. Dollar

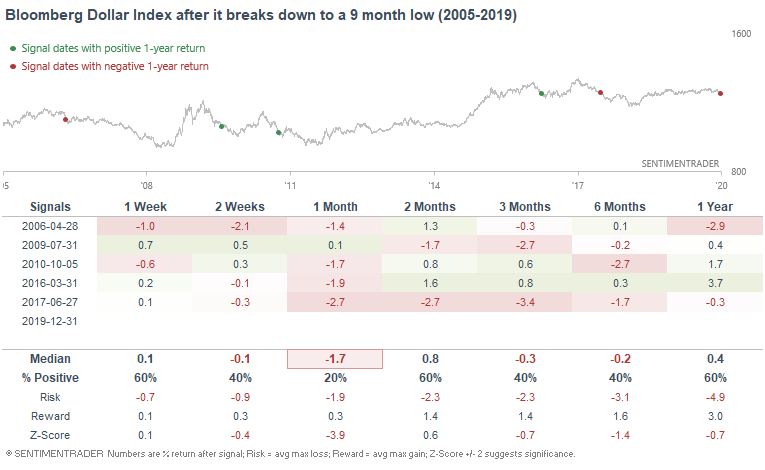
2019 saw extremely low volatility in forex markets, and perhaps that is coming to an end. The U.S. Dollar is starting to trend downwards, and the Bloomberg U.S. Dollar Index recently broke down to a 9 month low.

Such breakdowns in the past were usually followed by new lows over the next month for the Bloomberg Dollar Index (the sample size is small, which is a caveat).

This is an abridged version of our recent reports and notes. For immediate access with no obligation, sign up for a 30-day free trial now.

We also looked at:

  • What happens after futures gap up and Dumb Money Confidence is already high
  • The Nasdaq new high - new low ratio is the highest in 6 months
  • The same breadth stat for the NYSE is high, too
  • Financial conditions have greatly improved over the past year, what that means for stocks
  • The dollar's breakdown effect on the S&P 500
  • Copper just enjoyed a Golden Cross with the 50-day average crossing above the 200-day
PRODUCTS
SentimenTrader
Trading Tools
Indicators & Data API
‍
Strategies & Scanner
‍
Research Reports
FREE
RESOUrCES
Simple Backtest
Calculator
Simple Seasonality
Calculator
The Kelly Criterion
Calculator
Sentiment Geo Map
‍
Public Research Reports
‍
Education
Sentiment Indicators
‍
Technical Indicators
‍
Pricing
Bundle pricing
‍
FAQ
‍
Announcements
‍
COMPANY
‍
About
‍
In the News
‍
Testimonials
‍
Client Success Stories
CONTACT
‍
General Inquiries
‍
Media Inquiries
‍
Financial Professionals Inquiries
‍
© 2026 Sundial Capital Research Inc. All rights reserved.
Setsail Marketing
TermsPrivacyAffiliate Program
Risk Disclosure: The information and tools provided are for research and analytical purposes only and are not intended as investment advice. Market analysis involves uncertainty, and outcomes may differ from expectations. Users should conduct their own due diligence and consider their individual circumstances before making any financial decisions. Past performance is not necessarily indicative of future results.

Hypothetical Performance Disclosure: Hypothetical performance results have many inherent limitations, some of which are described below. No representation is being made that any account will or is likely to achieve profits or losses similar to those shown; in fact, there are frequently sharp differences between hypothetical performance results and the actual results subsequently achieved by any particular trading program. One of the limitations of hypothetical performance results is that they are generally prepared with the benefit of hindsight. In addition, hypothetical trading does not involve financial risk, and no hypothetical trading record can completely account for the impact of financial risk of actual trading. for example, the ability to withstand losses or to adhere to a particular trading program in spite of trading losses are material points which can also adversely affect actual trading results. There are numerous other factors related to the markets in general or to the implementation of any specific trading program which cannot be fully accounted for in the preparation of hypothetical performance results and all which can adversely affect trading results.

Testimonial Disclosure: Testimonials appearing on this website may not be representative of other clients or customers and is not a guarantee of future performance or success.