Products
SentimenTrader Trading Tools
‍
Backtest Engine
My Trading Toolkit
Correlation Analysis
Seasonality
Market Prediction
Indicators & Data API
‍
Proprietary Indicators & Charts
Market Data API
Strategies & Scanner
‍
50+ Trading Strategies
Smart Stock Scanner
Smart Option Scanner
Research Reports
‍
Research Solutions
Reports Library
Free Resources
Simple Backtest Calculator
Simple Seasonality Calculator
The Kelly Criterion Calculator
Sentiment Geo Map
Public Research Reports
Education
Sentiment Indicators
Technical Indicators
Pricing
Company
About
In the News
Testimonials
Client Success Stories
Contact
Log inLoginSign up
< BACK TO ALL REPORTS

Optimism resets to a more favorable condition for stocks

Dean Christians
2025-01-06
As measured by several composites, investor sentiment has reached its lowest point in over a year, highlighting diminished optimism toward the stock market. Similar resets in sentiment typically result in choppy near-term conditions but ultimately pave the way for the resumption of a bullish trend.

Key points:

  • Several sentiment composites dropped to the lowest level in more than a year, suggesting less optimism
  • Similar sentiment resets tended to result in a rally in the S&P 500 over a medium-term basis

Optimism resets, setting the stage for a resumption of the uptrend

Several sentiment-based composites, which measure a combination of investor surveys and real-money indicators, have declined to their lowest levels in over a year, indicating that investors have increasingly become less optimistic about the stock market outlook. 

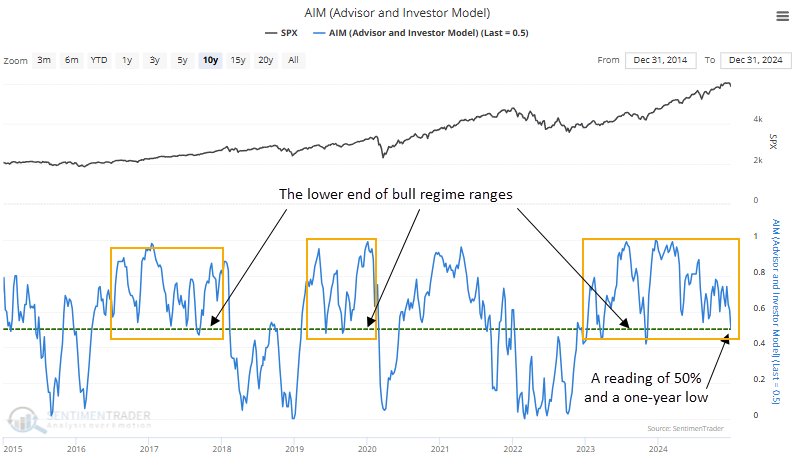
Furthermore, the current readings for these indicators have dropped to the lower bounds of their bull market ranges, a zone that historically attracts buying interest from traders, as depicted in the accompanying chart featuring the Advisor and Investor Model. 

Such pessimism can act as a contrarian indicator, as excessive caution among investors frequently sets the stage for a rally, a scenario we've seen over the last few sessions.

Similar sentiment resets suggest the uptrend resumes

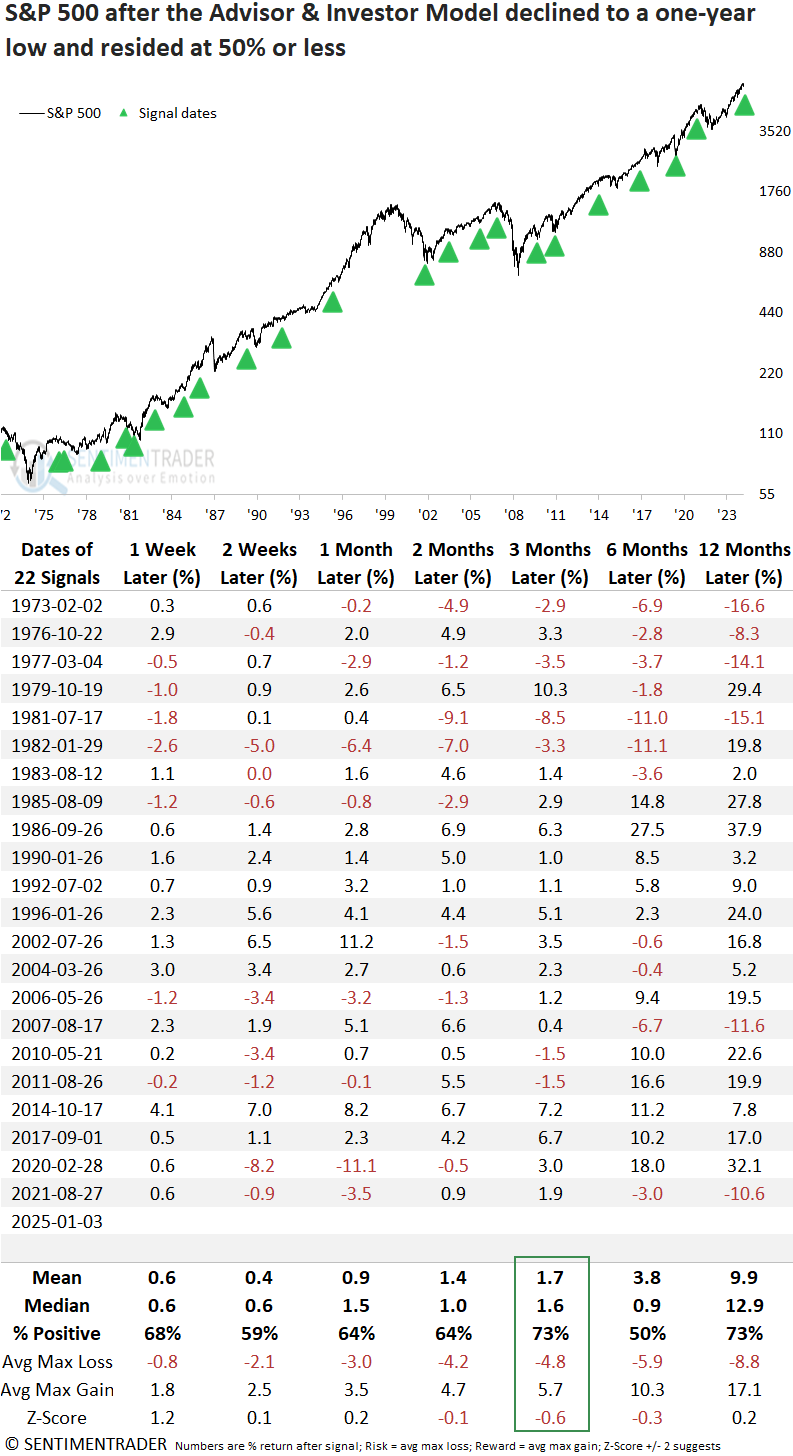
A decline in the Advisor and Investors Model to a one-year low and a reading of 50% or less tended to precede a rally in the S&P 500, with the world's most benchmarked index rising 73% of the time over the subsequent three months. Since the 1982 secular bottom in stocks, these occurrences have been even more bullish, with the index rising 88% of the time in the same horizon. 

Instances near a high

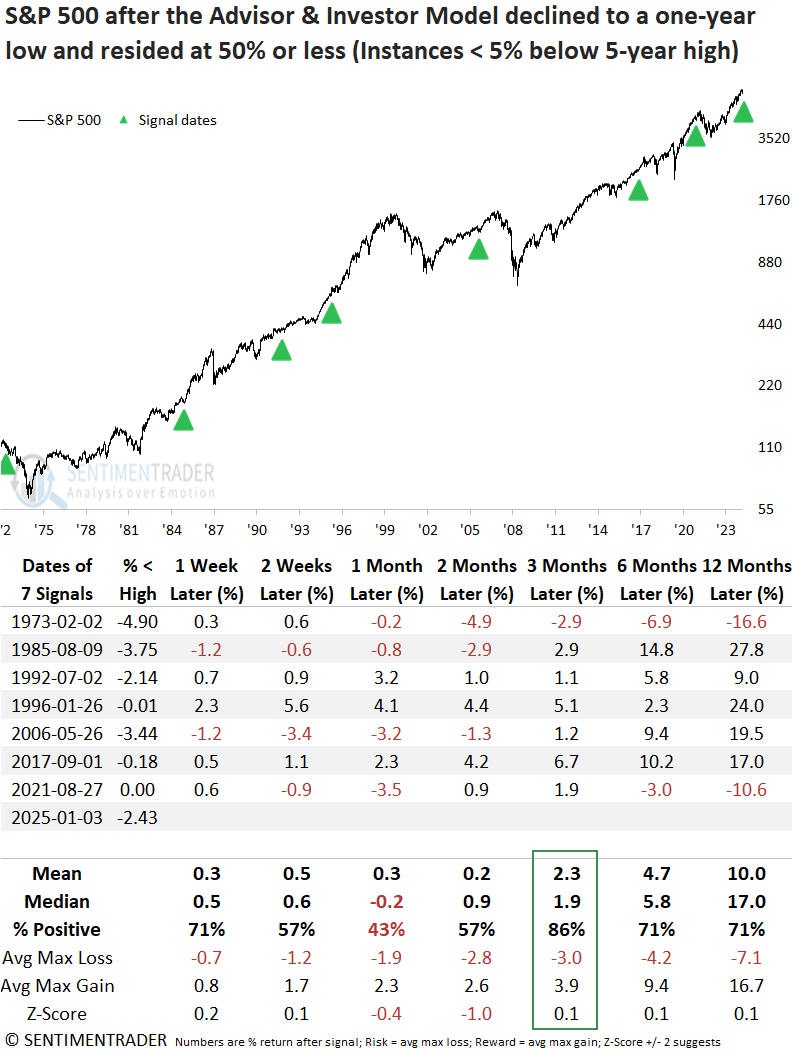
By isolating precedents near a high, a scenario like now, the win rate for the three-month interval rose to 86%, with the sole loss recorded in 1973. However, as indicated by the one-month time frame, some typical backing and filling could occur.

A real-money sentiment composite also suggests less optimism

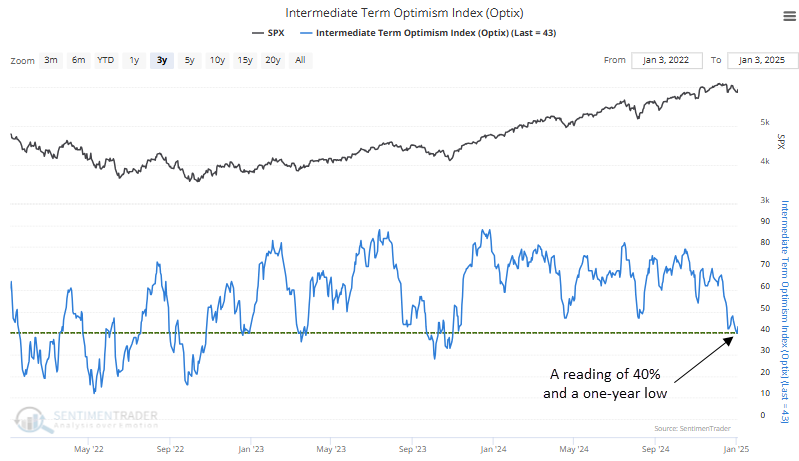
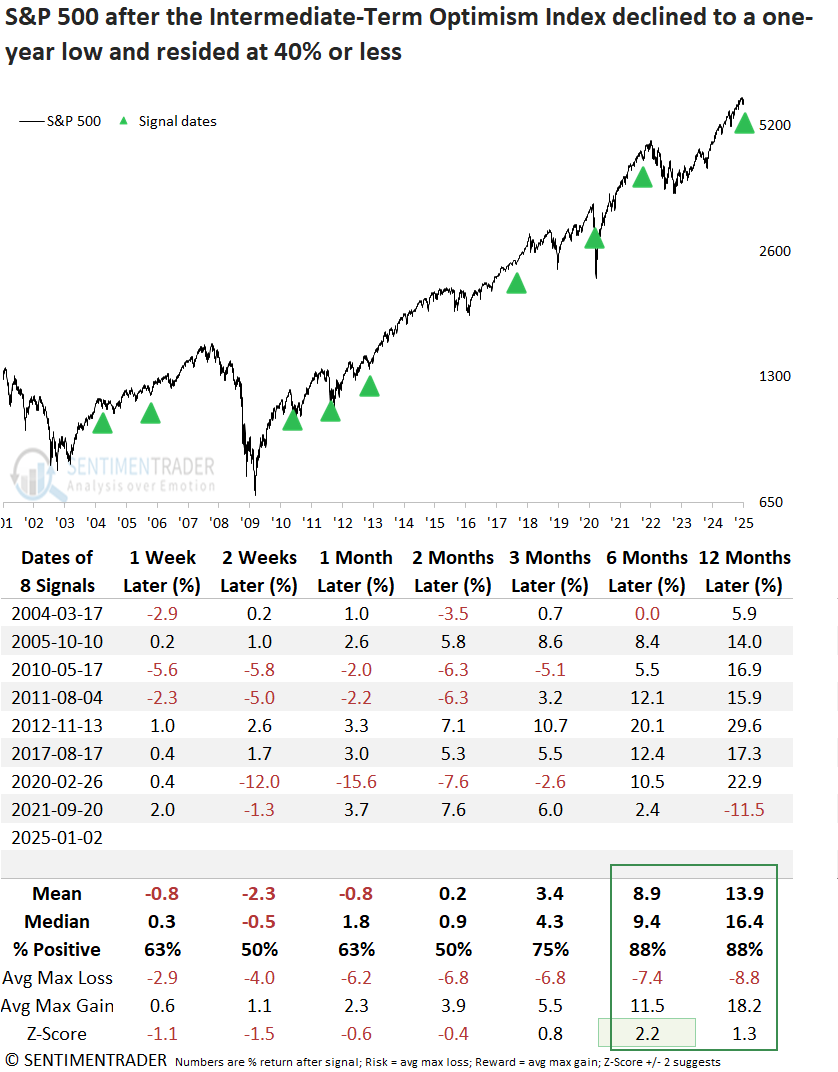
The Intermediate-Term Optimism Index, a composite that measures more real-money indicators like put/call ratios, mutual fund flows, and futures traders' positioning, also declined to a one-year low and a reading of 40%, suggesting far less optimism.

Despite its shorter history compared to the AIM model, when the Intermediate-Term Optimism Index declined to a one-year low, with a reading of 40% or less, the S&P 500 tended to perform well over long-term time frames, achieving an 88% win rate six and twelve months later.

Signals within 5% of a market high occurred in 2017 and 2021. Following the 2017 signal, the S&P 500 experienced a maximum six-month gain of 18%, with a maximum loss of -0.02%. Similarly, the 2021 signal led to a six-month maximum gain of 10% and a maximum loss of -4.3%. 

What the research tells us...

Sentiment among investors, whether captured by survey-based indicators in our Advisor and Investor Model or real-money metrics like our Intermediate-Term Optimism Index, has reset to a level historically linked to stock market rallies. Although not the textbook 'fat pitch' scenario that follows deeper corrections, the recent easing in optimism may provide sufficient fuel to reinvigorate the uptrend. That said, I wouldn't entirely dismiss the possibility of some turbulence in the near term.

PRODUCTS
SentimenTrader
Trading Tools
Indicators & Data API
‍
Strategies & Scanner
‍
Research Reports
FREE
RESOUrCES
Simple Backtest
Calculator
Simple Seasonality
Calculator
The Kelly Criterion
Calculator
Sentiment Geo Map
‍
Public Research Reports
‍
Education
Sentiment Indicators
‍
Technical Indicators
‍
Pricing
Bundle pricing
‍
FAQ
‍
Announcements
‍
COMPANY
‍
About
‍
In the News
‍
Testimonials
‍
Client Success Stories
CONTACT
‍
General Inquiries
‍
Media Inquiries
‍
Financial Professionals Inquiries
‍
© 2026 Sundial Capital Research Inc. All rights reserved.
Setsail Marketing
TermsPrivacyAffiliate Program
Risk Disclosure: The information and tools provided are for research and analytical purposes only and are not intended as investment advice. Market analysis involves uncertainty, and outcomes may differ from expectations. Users should conduct their own due diligence and consider their individual circumstances before making any financial decisions. Past performance is not necessarily indicative of future results.

Hypothetical Performance Disclosure: Hypothetical performance results have many inherent limitations, some of which are described below. No representation is being made that any account will or is likely to achieve profits or losses similar to those shown; in fact, there are frequently sharp differences between hypothetical performance results and the actual results subsequently achieved by any particular trading program. One of the limitations of hypothetical performance results is that they are generally prepared with the benefit of hindsight. In addition, hypothetical trading does not involve financial risk, and no hypothetical trading record can completely account for the impact of financial risk of actual trading. for example, the ability to withstand losses or to adhere to a particular trading program in spite of trading losses are material points which can also adversely affect actual trading results. There are numerous other factors related to the markets in general or to the implementation of any specific trading program which cannot be fully accounted for in the preparation of hypothetical performance results and all which can adversely affect trading results.

Testimonial Disclosure: Testimonials appearing on this website may not be representative of other clients or customers and is not a guarantee of future performance or success.