Products
SentimenTrader Trading Tools
‍
Backtest Engine
My Trading Toolkit
Correlation Analysis
Seasonality
Market Prediction
Indicators & Data API
‍
Proprietary Indicators & Charts
Market Data API
Strategies & Scanner
‍
50+ Trading Strategies
Smart Stock Scanner
Smart Option Scanner
Research Reports
‍
Research Solutions
Reports Library
Free Resources
Simple Backtest Calculator
Simple Seasonality Calculator
The Kelly Criterion Calculator
Sentiment Geo Map
Public Research Reports
Education
Sentiment Indicators
Technical Indicators
Pricing
Company
About
In the News
Testimonials
Client Success Stories
Contact
Log inLoginSign up
< BACK TO ALL REPORTS

Only the "crashiest" of precedents

Jason Goepfert
2020-03-06
We've seen quite a bit of evidence since last week that this is one of the most volatile periods in decades. In some respects, it's the most volatile on record.

We've seen quite a bit of evidence since last week that this is one of the most volatile periods in decades. In some respects, it's the most volatile on record.

Traders are faced with yet more uncertainty heading into the open, with futures down more than 3%. Below, we can see every time they gapped down at least 3% when the VXO (the "old VIX" that has more history) had hit at least 45 the prior day. These are panicky gaps open when traders were already panicked to begin with.

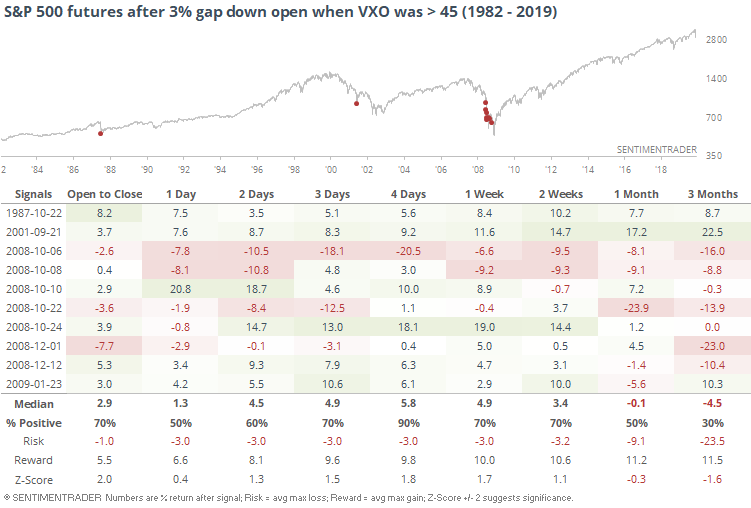
This has only happened during the "crashiest" markets, and there were a couple of very scary precedents on there.

Anyone buying into the fear had to endure some of the most volatile swings since the inception of the futures, not appetizing especially if trading a leveraged instrument like the futures are. At least over the next four sessions, they gained ground every time but once...though that "once" would have torpedoed a leveraged trading account.

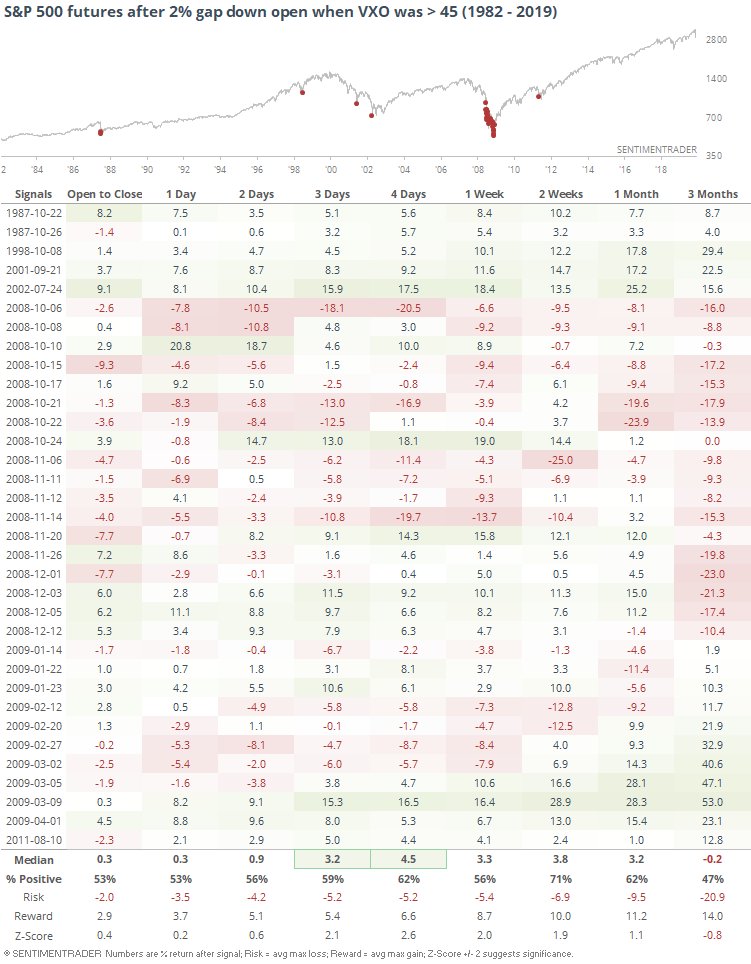
There were quite a few more instances if we look for a smaller gap down, like 2%.

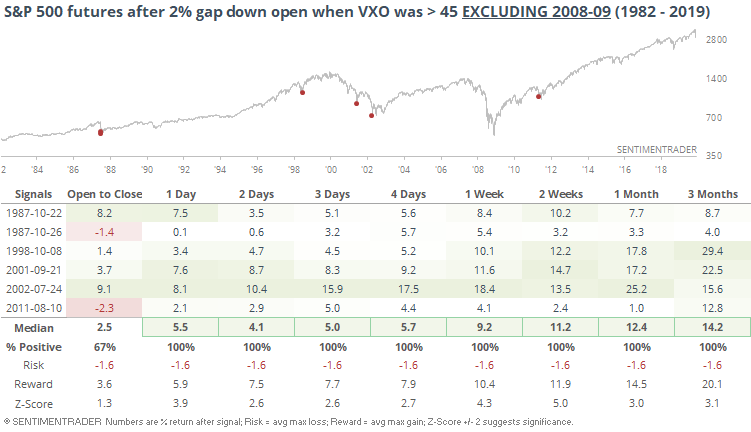
If we want to assume that we're not in the midst of the second coming of the Great Financial Crisis and commit the sin of excluding 2008-09, then the returns look pristine.

This would mark the 9th time in the past 10 sessions that futures had an intraday high or low that was more than 2.9% from the prior day's close. This is 2nd only to the crash of 2008. The only other times that reached even 8 days were around the bottoms in 1987 and 2002.

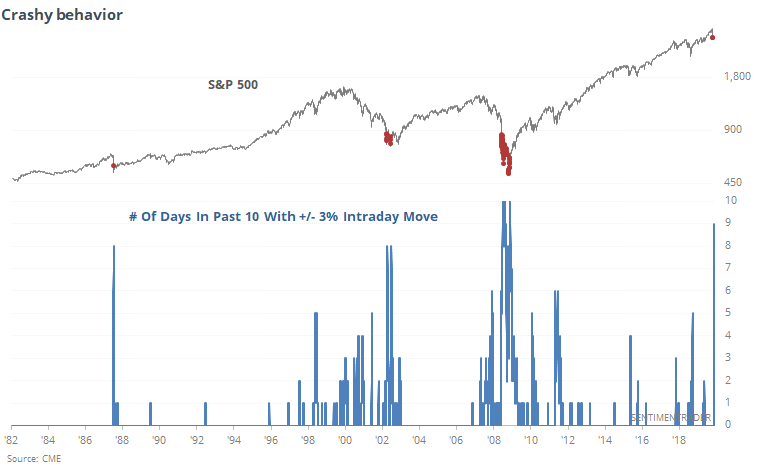
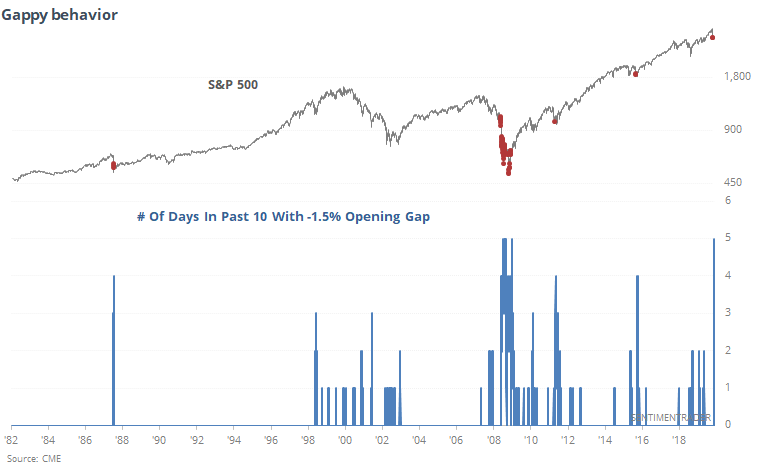
This would also mark the 5th session in the past 10 with an opening gap of more than -1.5%. That's tied for the most all-time, triggering only in October-November 2008 and April 2009.

Based on these measures and others we've looked at over the past week or so, we're seeing a historic level of volatility, wholesale selling pressure, and panicky behavior. Essentially what it comes down to is that a buyer (or holder) here is betting that this panic is a once-in-a-decade type of thing, and not another once-in-a-generation game-changer like the financial crisis.

PRODUCTS
SentimenTrader
Trading Tools
Indicators & Data API
‍
Strategies & Scanner
‍
Research Reports
FREE
RESOUrCES
Simple Backtest
Calculator
Simple Seasonality
Calculator
The Kelly Criterion
Calculator
Sentiment Geo Map
‍
Public Research Reports
‍
Education
Sentiment Indicators
‍
Technical Indicators
‍
Pricing
Bundle pricing
‍
FAQ
‍
Announcements
‍
COMPANY
‍
About
‍
In the News
‍
Testimonials
‍
Client Success Stories
CONTACT
‍
General Inquiries
‍
Media Inquiries
‍
Financial Professionals Inquiries
‍
© 2026 Sundial Capital Research Inc. All rights reserved.
Setsail Marketing
TermsPrivacyAffiliate Program
Risk Disclosure: The information and tools provided are for research and analytical purposes only and are not intended as investment advice. Market analysis involves uncertainty, and outcomes may differ from expectations. Users should conduct their own due diligence and consider their individual circumstances before making any financial decisions. Past performance is not necessarily indicative of future results.

Hypothetical Performance Disclosure: Hypothetical performance results have many inherent limitations, some of which are described below. No representation is being made that any account will or is likely to achieve profits or losses similar to those shown; in fact, there are frequently sharp differences between hypothetical performance results and the actual results subsequently achieved by any particular trading program. One of the limitations of hypothetical performance results is that they are generally prepared with the benefit of hindsight. In addition, hypothetical trading does not involve financial risk, and no hypothetical trading record can completely account for the impact of financial risk of actual trading. for example, the ability to withstand losses or to adhere to a particular trading program in spite of trading losses are material points which can also adversely affect actual trading results. There are numerous other factors related to the markets in general or to the implementation of any specific trading program which cannot be fully accounted for in the preparation of hypothetical performance results and all which can adversely affect trading results.

Testimonial Disclosure: Testimonials appearing on this website may not be representative of other clients or customers and is not a guarantee of future performance or success.