
One useful credit spread indicator turns unfavorable

Key Points
- We will look at a credit spread that measures the calculated spreads between a computed index of all bonds in a given rating category and a spot Treasury curve
- Credit spreads can offer warnings when they behave abnormally
- Typically, relatively smooth sideways action indicates a favorable environment for stocks and the overall economy
- In addition, credit spreads typically move inversely to stock prices
- However, over time there can be wide swings in the level of correlation between credit spreads and stocks
- Recognizing extremes in these correlation swings can alert investors to favorable and unfavorable environments for stocks
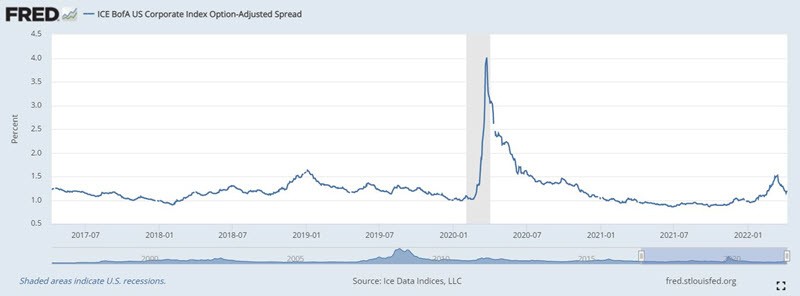
ICE BofA US Corporate Index Option-Adjusted Spread
The indicator we start with is the ICE BofA US Corporate Index Option-Adjusted Spread which can be accessed here. This spread represents the Option-Adjusted Spread (OAS) of the ICE BofA AA US Corporate Index, a subset of the ICE BofA US Corporate Master Index tracking the performance of US dollar-denominated investment grade rated corporate debt publicly issued in the US domestic market. For simplicity, we will use only month-end values in our analysis and will heretofore refer to this as "Credit Spread*."
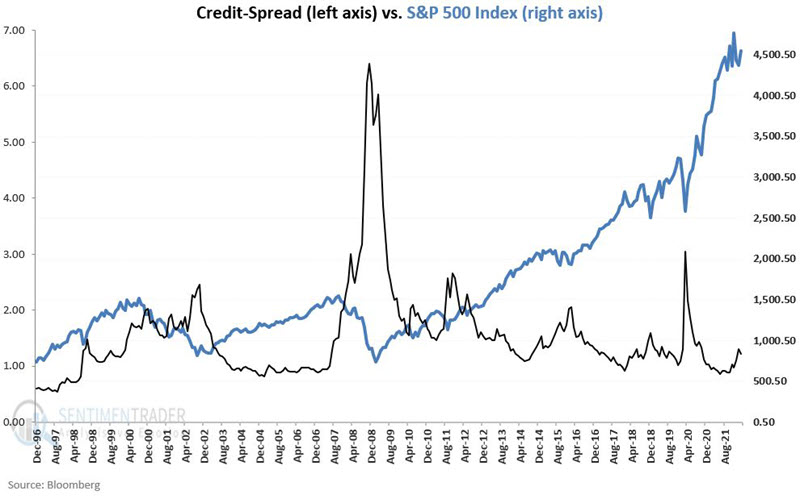
The second piece of data is the S&P 500 Index month-end closing price. The chart below puts both data series on the same chart, with the credit spread axis on the left and the S&P 500 Index axis on the right.
Building an Indicator
In our analysis, the indicator we will use is the correlation between the Credit Spread* and the S&P 500 Index over the latest ten months. As you can see in the chart above, there is a strong tendency for these two series to be non-correlated. However - as we will see - the level of correlation can swing widely over time. We will use these swings to designate the indicator as "favorable" or "unfavorable" for stocks.
The variables appear below:
A = Month-end Credit Spread*
B = Month-end S&P 500 price
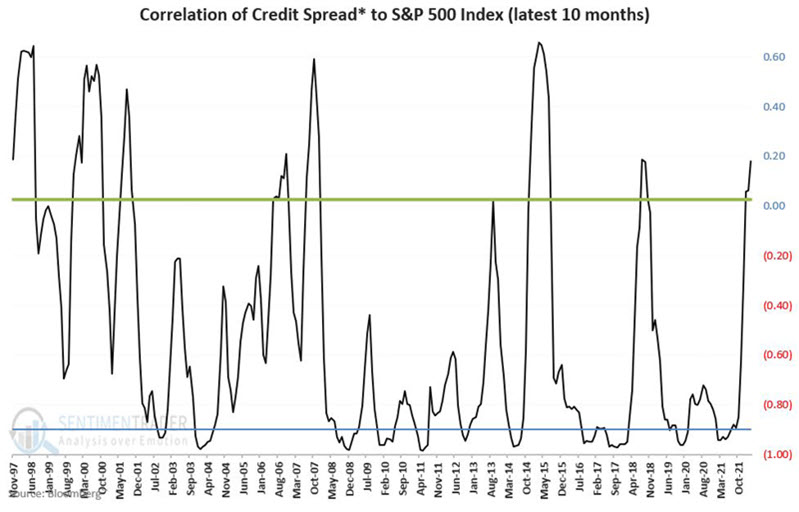
C = Correlation of A and B over the past ten months
D = 0.027
E = -0.900
The chart below displays variables C, D, and E.
Rules
- If C crosses above D (0.027), the indicator is "Unfavorable" for stocks
- If C crosses above E (-0.90), the indicator is "Favorable" for stocks
A little clarification:
- As soon a Variable C registers a monthly close of 0.27 or higher, the indicator flips to "Unfavorable."
- In other to turn "Favorable," Variable C must a) first register a monthly close BELOW -0.90, and then b) subsequently register a monthly close back ABOVE -0.90
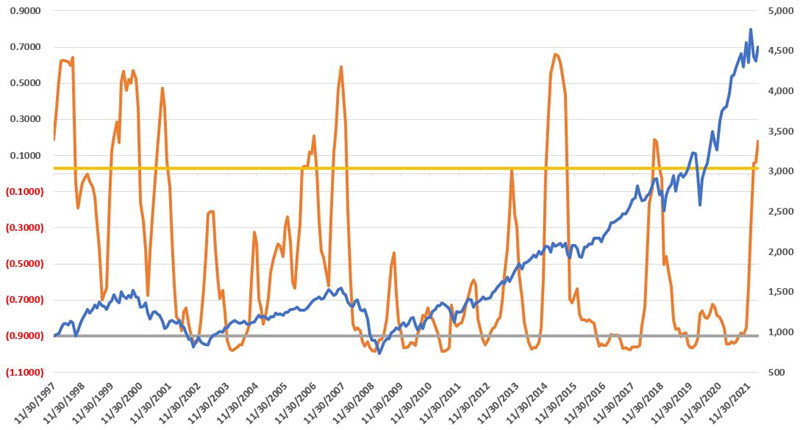
To highlight the relationship between the indicator and the S&P 500 Index, both are plotted below, with the correlation value axis on the left and the S&P 500 Index axis on the right.
Performance results
The table below displays the "Favorable" and "Unfavorable" period start and end dates as the performance of the S&P 500 Index during each period.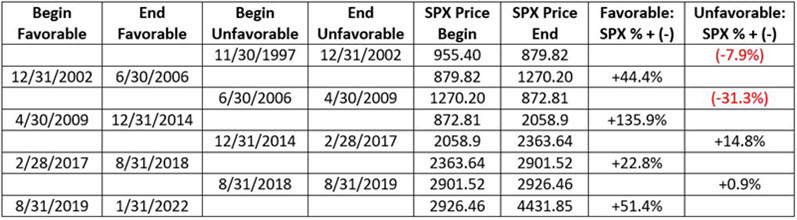
The chart below displays the growth of $1 in the S&P 500 Index held only during "Unfavorable" periods.
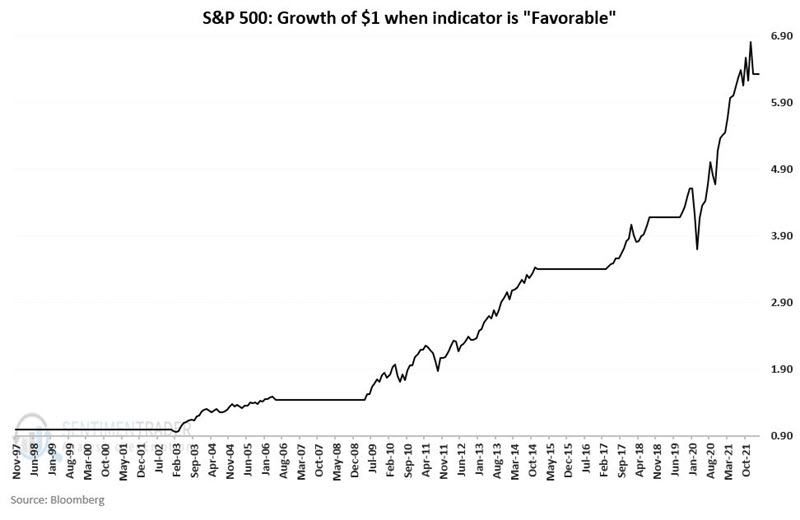
The chart below displays the growth of $1 in the S&P 500 Index held only during "Unfavorable" periods.
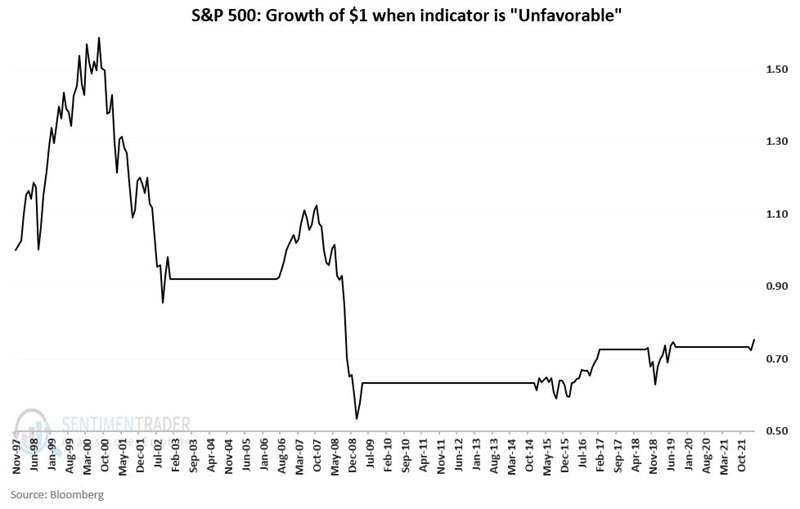
Since 1997:
- During Favorable periods the S&P 500 gained +533%
- During Unfavorable periods the S&P 500 lost -24.8%
What the research tells us…
Stable credit spreads indicate "normal" economic circumstances (i.e., steady growth). When credit spreads begin to act abnormally and become volatile, it offers a potential warning sign that something is amiss. The recent high correlation between credit spreads and stocks is not an "automatic" sell signal. Sometimes the stock market chops a bit before regaining its footing. Other times a significant bear market ensues.
The indicator detailed in this piece is not intended to serve as a standalone buy and sell signal generating system. But as a "weight of the evidence" tool, it can offer valuable clues regarding the current relative state of the stock market and the overall economy.