
One sentiment indicator issues a warning for metals

Key Points
- A December 2024 note suggested the potential for strength in the metals market early in 2025
- The metals markets have performed well so far in 2025
- Our Platinum Optix has recently flashed a warning signal that suggests that the sledding may get more difficult in the months ahead
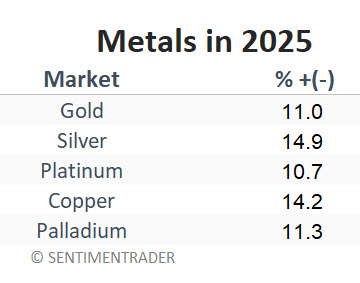
Metals have been strong so far in 2025
In a note dated 2024-12-30, I discussed the potential for strength in the metals markets early in 2025. So far, so good, as highlighted in the table below
With each of the markets above presently in a confirmed price uptrend, it makes sense to continue to give the bullish case the benefit of the doubt. It is also important to remember that even the best rallies will see periods of pullback and/or consolidations. As a result, it can be helpful to keep an eye on the horizon for any potential warning signs.
We highlight one such potential warning sign for metals below. The overarching message from the results highlighted below is NOT one of "Sell All Metals!" The real message is best expressed in:
Jay's Trading Maxim #18: Follow the trend, but DO NOT fall in love with the trend.
For shorter-term traders, the message is also one of "look for opportunities to lock in profits."
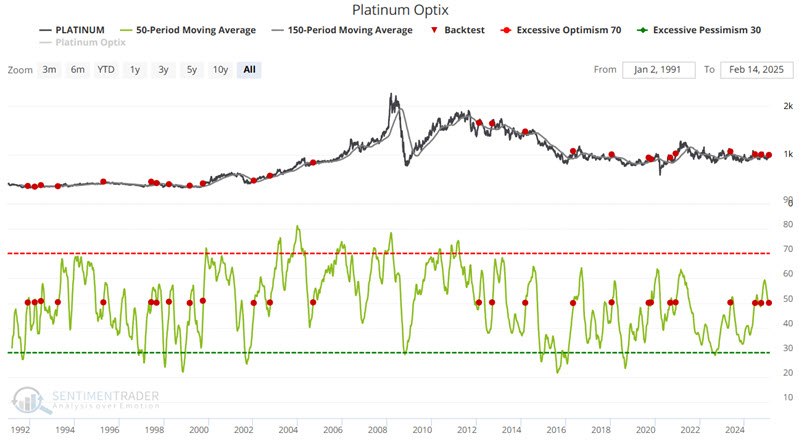
Platinum Optix flashes a warning
The chart below highlights with a red dot each time the 50-day average for Platinum Optix crossed above 50 while platinum futures exceeded their 150-day moving average.
The table summarizes subsequent platinum performance. The key points are the negative median returns and sub-50% Win Rates across the board.
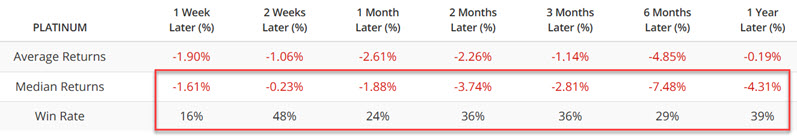
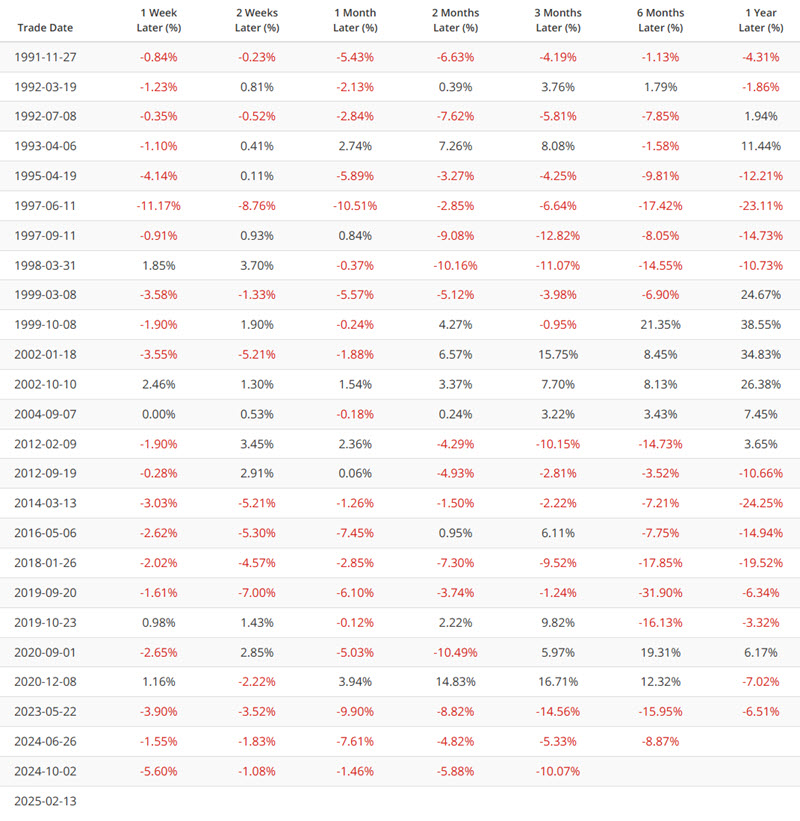
Some might conclude that platinum will flounder in the year ahead from the table above. However, the table below displays results on a signal-by-signal basis. Note that platinum continued to perform very well in 1993, 1999, 2002, and 2004. Hence, we refer to the latest signal from the Optix indicator as a "warning" and NOT an outright "Sell" signal.
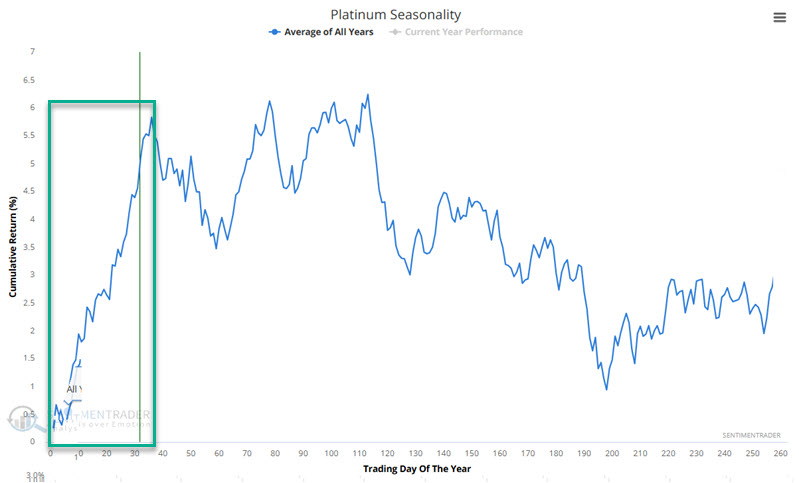
It is also worth noting that the "Most Platinum Time of the Year" is winding down.
Now, let's apply the Platinum Optix signal to the other metals.
Gold versus Platinum Optix
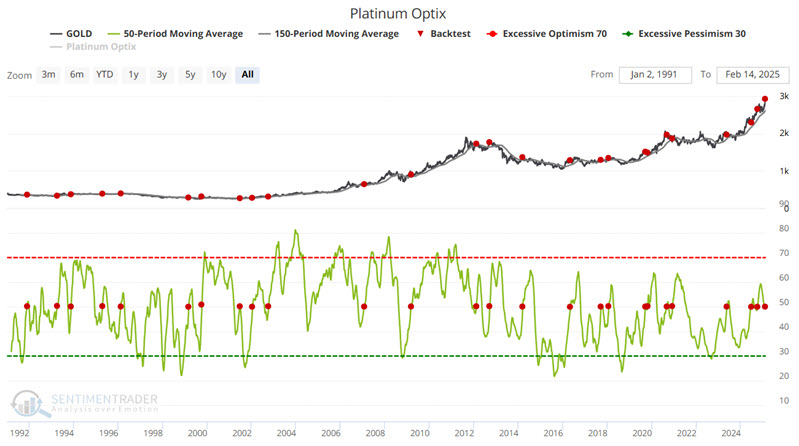
The chart below highlights with a red dot each time the 50-day average for Platinum Optix crossed above 50 while gold futures were above their 150-day moving average.
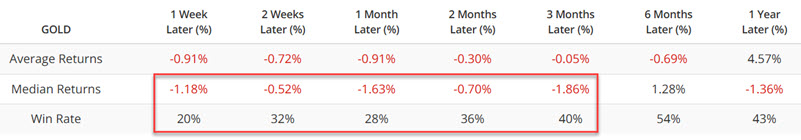
The table summarizes subsequent gold performance. The numbers suggest the potential for a short-term pullback/consolidation more than an outright bearish signal, suggesting the onset of a new bear market in gold.
The table below displays results on a signal-by-signal basis. Again, we see an overall tendency for subsequent price weakness BUT with notable exceptions.
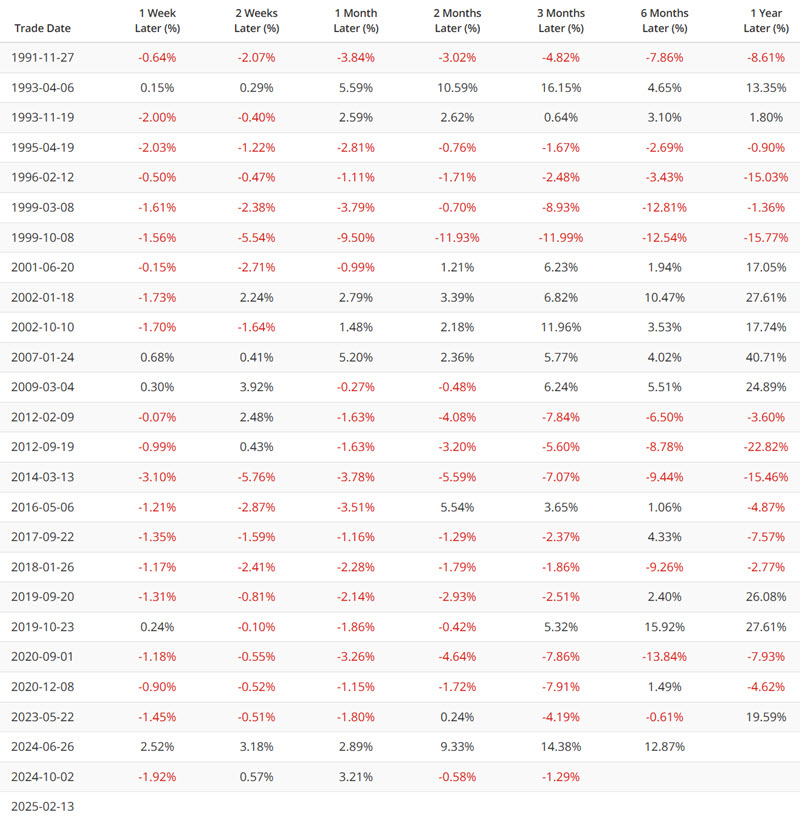
While we never view an annual season trend chart as a roadmap, the gold chart suggests we should not be surprised if gold spends a few months consolidating.
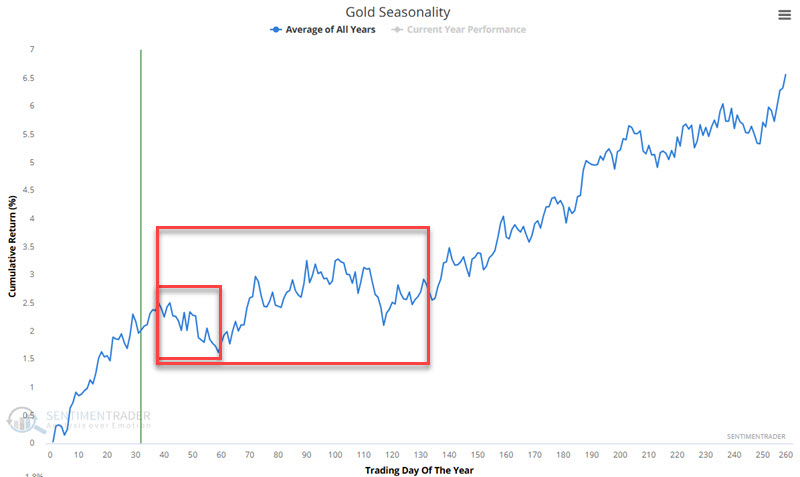
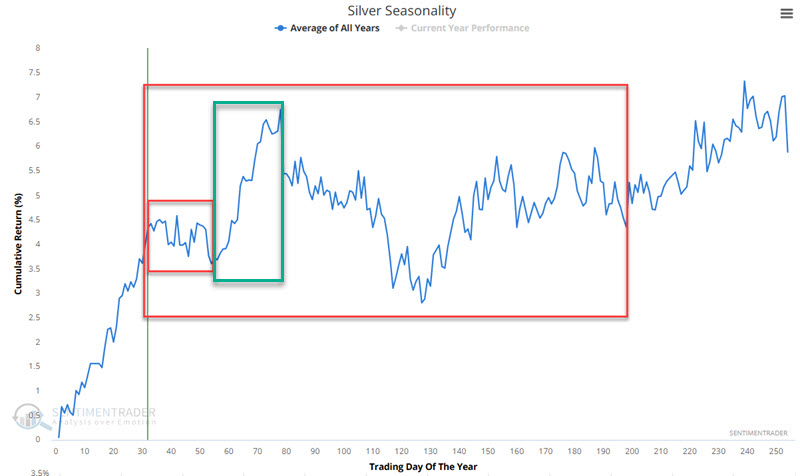
Silver versus Platinum Optix
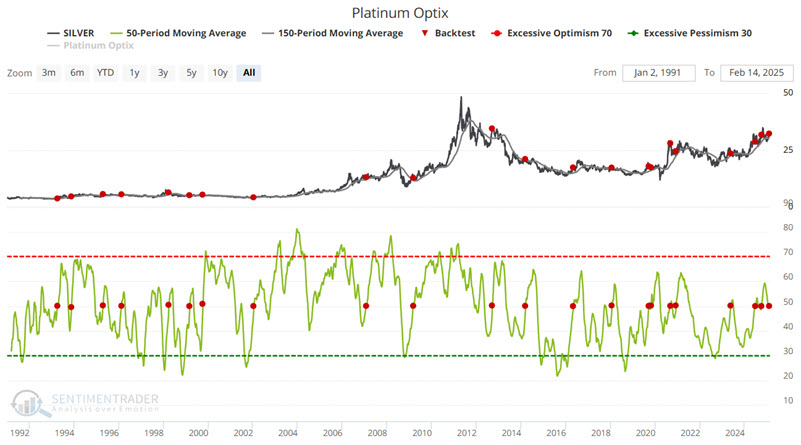
The chart below highlights with a red dot each time the 50-day average for Platinum Optix crossed above 50 while silver futures were above their 150-day moving average.
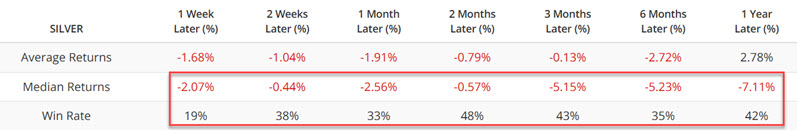
The table summarizes subsequent silver performance. These numbers show general weakness across the board.
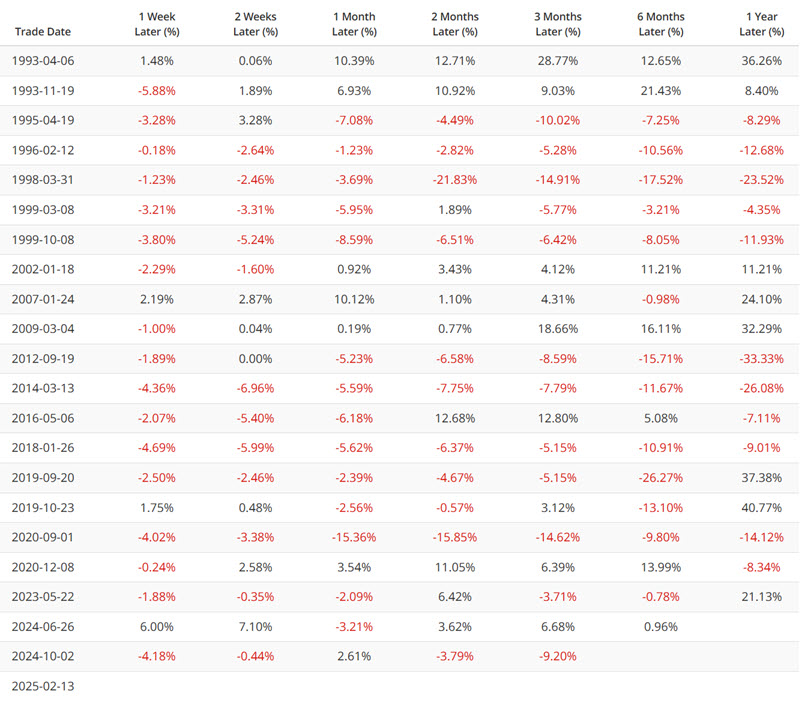
The table below displays results on a signal-by-signal basis. Short-term weakness is typical; however, note that 1-year results vary widely, from extreme strength on some occasions to extreme weakness on others.
The silver annual seasonal trend map suggests potential further upside in the next several months, followed by consolidation.
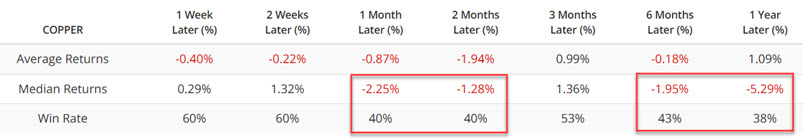
Copper versus Platinum Optix
The chart below highlights with a red dot each time the 50-day average for Platinum Optix crossed above 50 while copper futures were above their 150-day moving average.
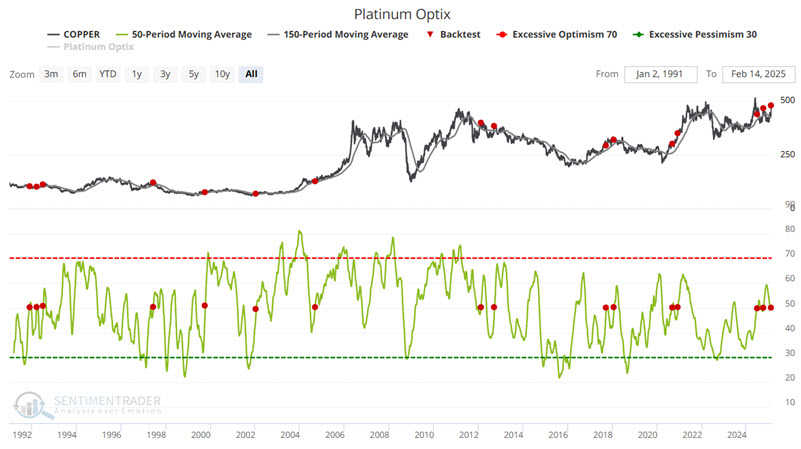
The table summarizes subsequent copper performance. The results are again decidedly mixed, with an overall tendency for weakness. Win Rates are slightly higher than platinum, gold, and silver.
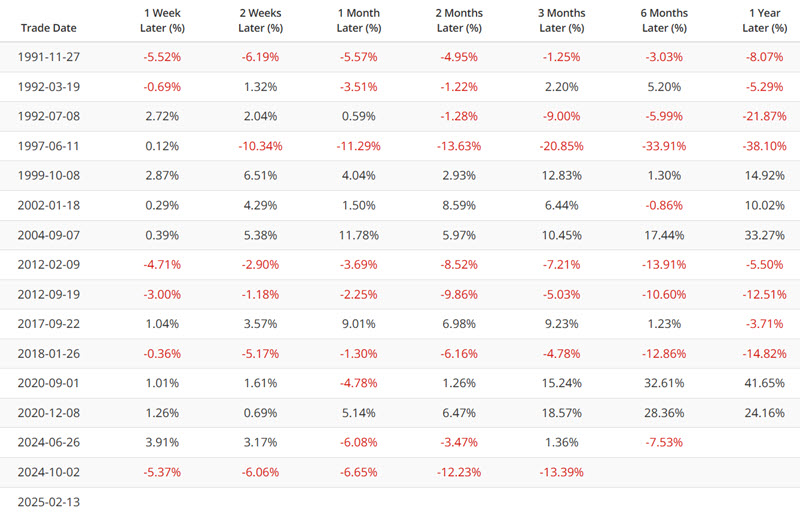
The table below displays results on a signal-by-signal basis.
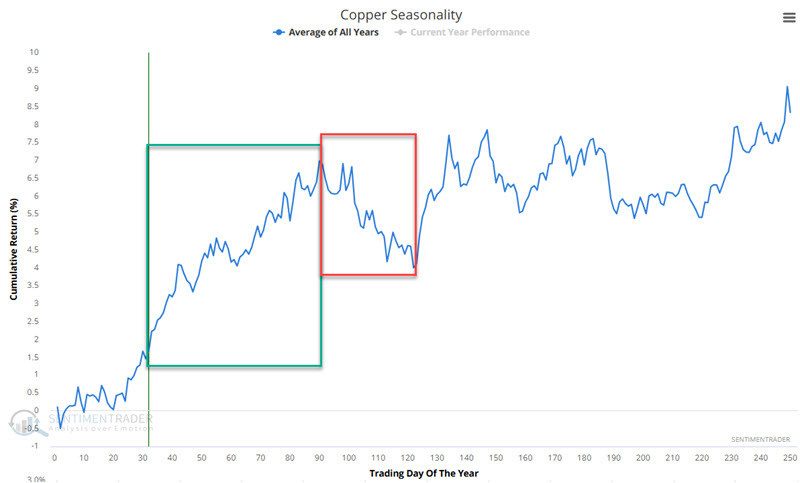
The copper annual seasonal trend chart suggests the potential for further upside in copper before a meaningful consolidation.
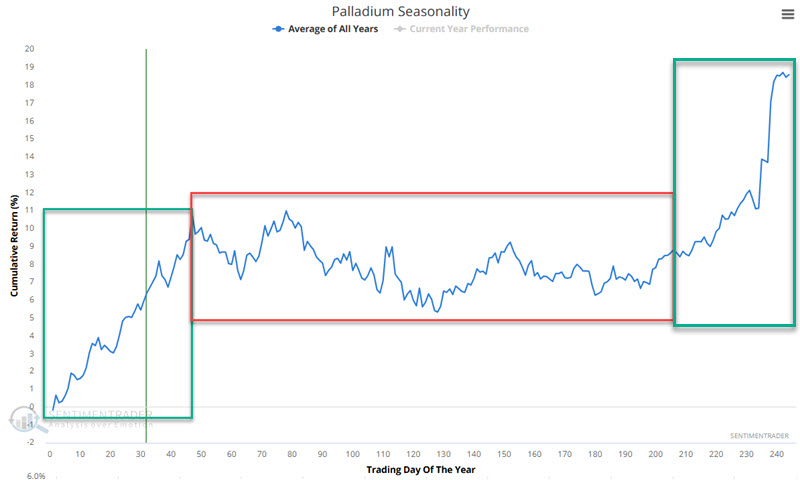
Palladium versus Platinum Optix
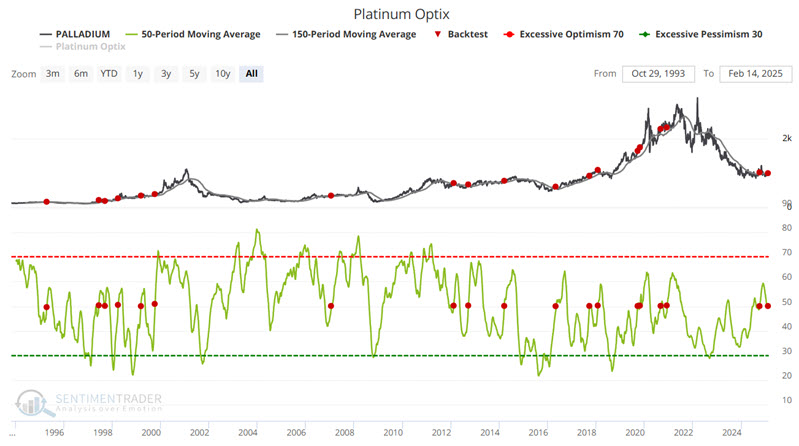
And now for an exception to the rule. The chart below highlights with a red dot each time the 50-day average for Platinum Optix crossed above 50 while palladium futures were above their 150-day moving average.
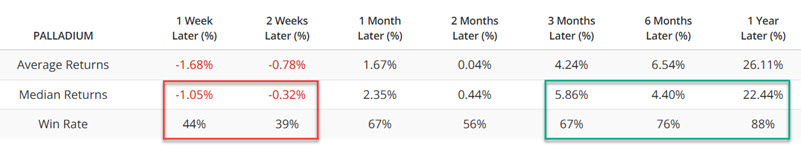
The table summarizes subsequent palladium performance. The first several weeks have shown a tendency for weakness; however, the rest of the time, unlike the other metals, has tended towards strength. The key things to note are the 88% Win Rate and 22.44% median return for 1-year results.
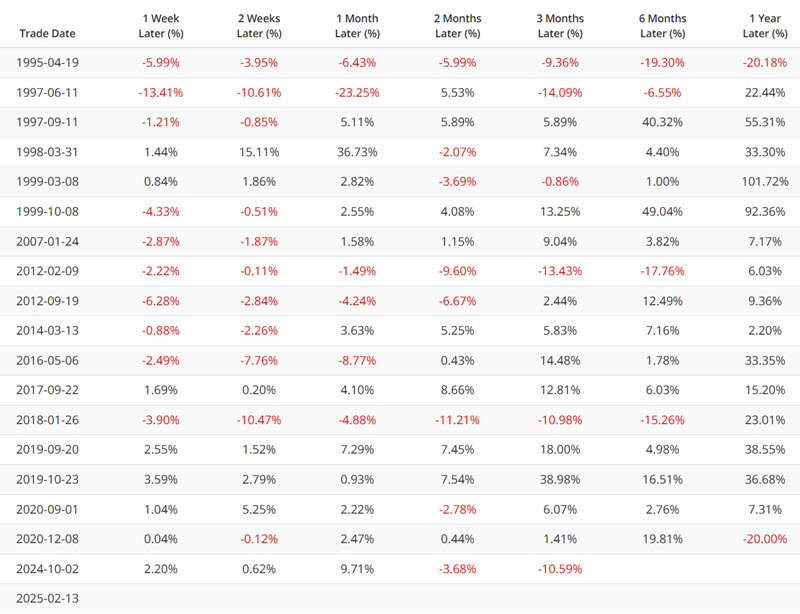
The table below displays results on a signal-by-signal basis. The bad news is the -20%+ declines in the year following the 1995 and 2020 signals. The good news is the 1-year returns for just about every signal in between. Between 1997 and 2020, fifteen consecutive Platinum Optix signals were followed by a gain in Platinum, with ten of those fifteen showing an increase of over +15% (seven of the fifteen showed a subsequent gain of over +30%).
So, is Palladium "the secret weapon" for metals traders in the year ahead? That is impossible to predict; however, historical numbers suggest investors should be open to the possibility.
The annual seasonal chart for palladium suggests that traders looking to participate in a rally in the next year may find a good buying opportunity during the middle of the year.
An ETF alternative for non-futures traders
Most individuals will never (and, in all candor, probably should never) come close to trading palladium futures. However, investors who wish to gain exposure to palladium can buy shares of the abrdn Physical Palladium Shares ETF (ticker PALL) just as they would shares of stock.
What the research tells us…
The knee-jerk reaction to the data above is that the metals markets are due for a "pause" following a good run higher for most of the markets. Whether that is how it plays out remains to be seen, but - as they say - you've been warned. The most intriguing possibility may lie in the off-the-beaten-path palladium market.