
One reason to be wary of major currencies

Key points
- The British Pound and the Euro have a history of showing weakness early in the year
- The decisions to be made by traders are a) whether to play these trends and b) how to play them
A period of typical weakness for the British Pound
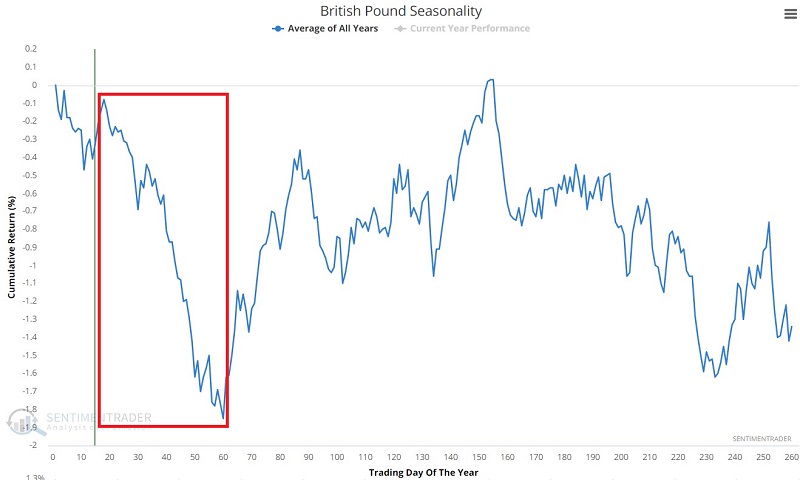
The chart below displays the annual seasonal trend for the British Pound. Note the period of typical weakness between late January and late March.
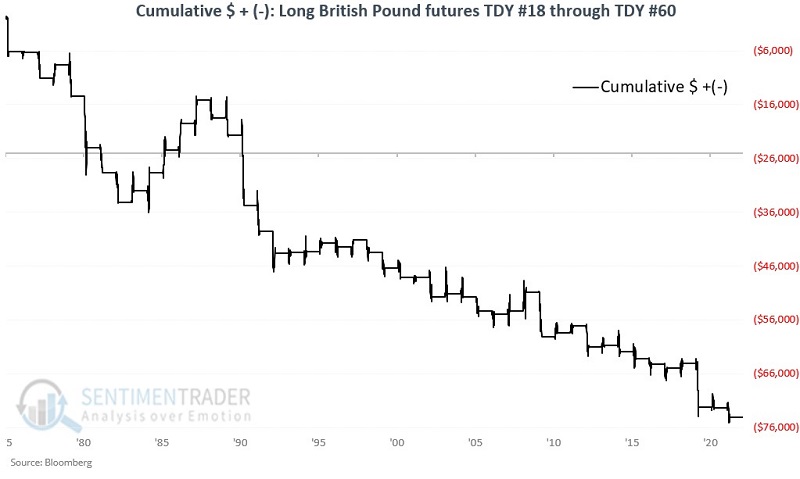
The table below displays the cumulative hypothetical equity curve achieved by holding long one British Pound futures contract from the close of the trading day of the year (TDY) #18 through TDY #60 every year since 1976.
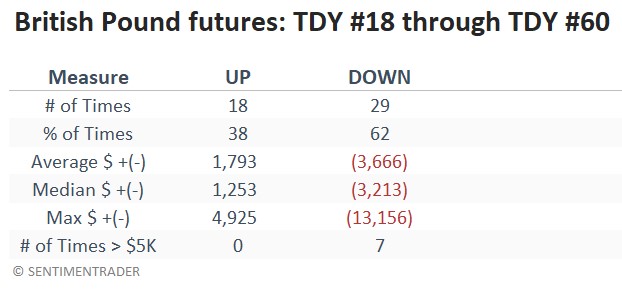
The table below summarizes performance.
For 2023, this unfavorable period for the Pound extends from the close on 2023-01-25 through the close on 2023-03-24.
A similar unfavorable trend for the Euro
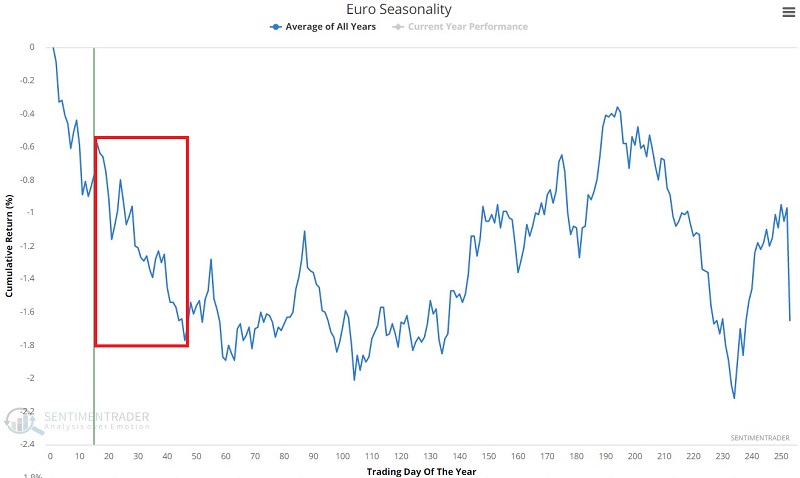
The chart below displays the annual seasonal trend for the Euro. This currency has historically shown weakness from New Year's Day into mid to late March. So far, in 2023, the Euro has bucked this trend and traded higher. However, this luck may run out if history proves an accurate guide.
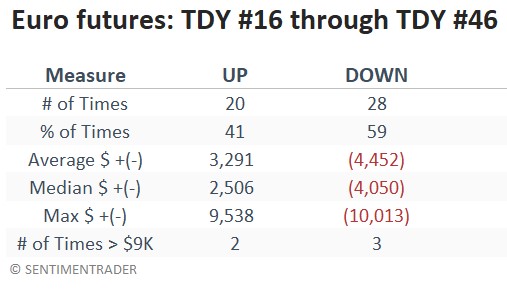
The table below displays the cumulative hypothetical equity curve achieved by holding long one Euro futures contract from the close of the trading day of the year (TDY) #16 through TDY #46 every year since 1975. NOTE: Euro futures began trading in 1999. Results before 1999 were generated using an index calculated by Bloomberg using the estimated value of the Euro based on other related currencies.

The table below summarizes performance. Note that before 1999 (with results generated using a hypothetical Euro index), there were ten up periods and 14 down periods. Since Euro futures started trading in 1999, there have also been ten up periods and 14 down periods.
For 2023, this unfavorable period for the Euro extends from the close on 2023-01-23 through the close on 2023-03-06.
Trading currencies
The most straightforward approach to playing the trends above would be to sell short a British Pound and/or Euro futures contract. However, a trader should be well-capitalized and familiar with the potentially unlimited risk of futures trading. Part of the trading decision is also deciding in advance when to cut a loss if the particular currency rallies.
A move in price for the Euro futures contract from 1.09 to 1.10 equates to a $1,250 change in contract value. A move in the price for the British Pound futures contract from 1.23 to 1.24 equates to a $625 change in contract value.
An alternative for non-futures traders would be to sell short shares of the Invesco CurrencyShares British Pound Sterling ETF (ticker FXB) and/or the Invesco CurrencyShares Euro Trust ETF (ticker FXE). However, selling these shares short would involve trading in a margin account and assuming unlimited risk. Here too, deciding how much to risk and where to place a stop-loss order is a crucial - and individual - decision.
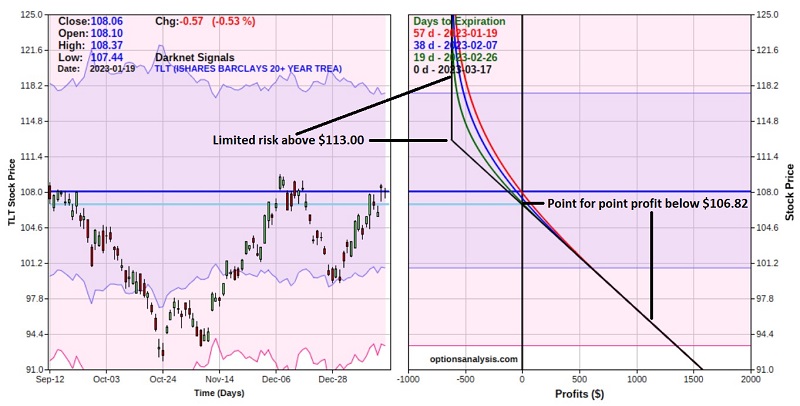
One other alternative would be to trade options on FXB or FXE. Note, however, that trading in these options can be extremely thin. This means trading in meaningful size and getting good fills may be difficult. Nevertheless, for a trader so inclined, this approach offers limited risk. To highlight the possibility, the screenshots below (courtesy of Optionsanalysis) highlight the particulars and risk curves (risk curves display the expected P/L for a given option position at a given price for the underlying security as of a given date) for the following position:
- Long 1 Mar17 2023 FXE 101 strike price put option @ $1.40
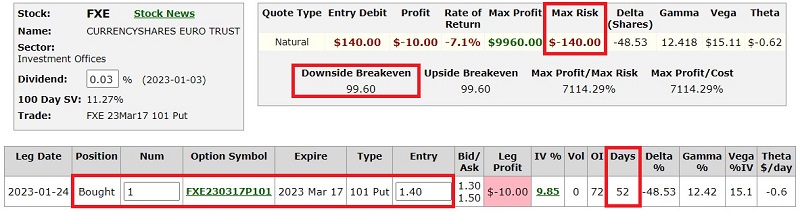
With FXE trading at $100.43 a share, this option would cost $140 for a 1-lot (also the maximum risk). The breakeven price for this position would be $99.60. Below that price, this option would gain $100 in value for each $1 that FXE shares decline in price.
What the research tells us…
The currencies highlighted above have shown a historical tendency for weakness during the year's first quarter. There are caveats to consider. First, the Win Rate has been 62% for the Pound and 58% for the Euro - so, indeed no "sure thing." The other caveat is the answer to the question of "how to play?" Trading currency futures, selling short shares of an ETF, or trading in thinly traded ETF options entail certain inherent risks that must be carefully considered.