Data &
Technology
Research
Reports
Report Solutions
Reports Library
Actionable
Strategies
Free
Resources
Simple Backtest Calculator
Simple Seasonality Calculator
The Kelly Criterion Calculator
Sentiment Geo Map
Public Research Reports
Free Webinar
Pricing
Company
About
Meet Our Team
In the News
Testimonials
Client Success Stories
Contact
Log inLoginSign up
< BACK TO ALL REPORTS

One of the worst days in market history

Jason Goepfert
2020-03-10
Monday's session was among the worst in 60 years. The put/call ratio jumped to one of the highest readings in history as traders scrambled for puts.

Wholesale selling

Many times over the years, we’ve seen that when more than half of a sector trades to a new low at the same time, it’s a consistent signal that investors have panicked.

It doesn’t happen very often in individual sectors, and it’s even less common when looking at all of them together. That’s what we saw on Monday, with over half of securities on the NYSE falling to a 52-week low.

NYSE 52-week lows

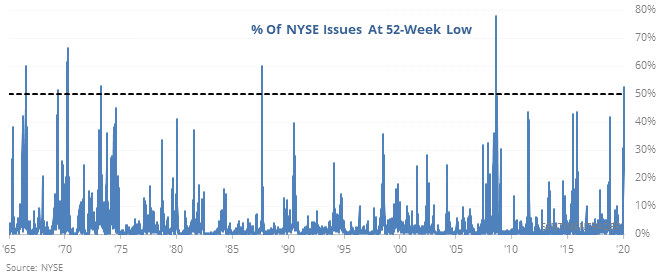
Breadth statistics get less reliable the further back we go, especially on some individual days. Based on the data we have, such a spike in new lows occurred as stocks were tipping into bear markets in 1969 and 1973, though both of those also showed gains as stocks enjoyed a relief rebound over the next couple of months.

Other than those two, it only triggered during the final stages of meltdowns.


Put/Call

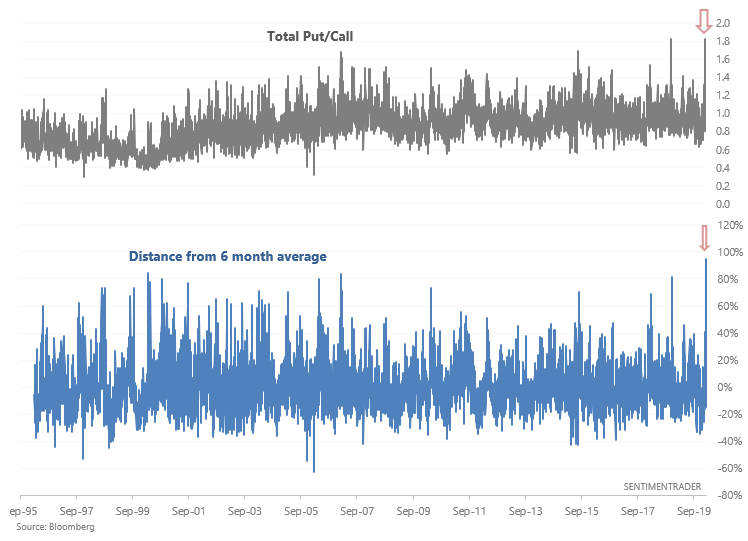
As plenty of market watchers on Twitter have noted, the Put/Call ratio spiked on Monday's stock market crash. Our De-Trended Equity Put/Call ratio is at a level that in the past, usually led to a S&P 500 rally over the next month.

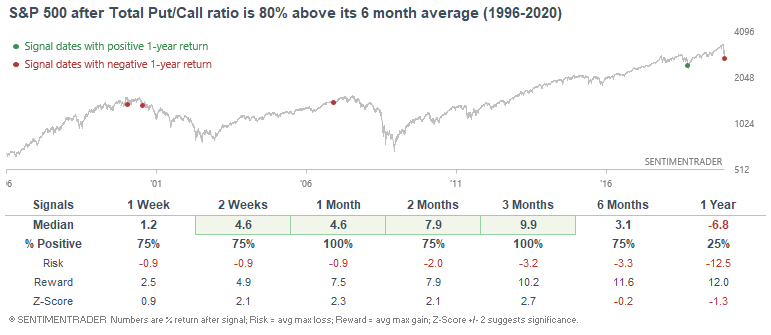
The Total Put/Call ratio is now the most above its 6 month average ever:

Jump in the put/call ratio

The only few comparable cases saw the S&P 500 rally over the next few weeks and months, even though 2 of these cases (April and October 2000) occurred at the start of a major bear market:

Big jumps in the put/call ratio


This is an abridged version of our recent reports and notes. For immediate access with no obligation, sign up for a 30-day free trial now.

We also looked at:

  • Monday's session showed the 3rd-worst breadth since 1962 on the NYSE
  • A detailed look at "worst-case" scenarios
  • Large opening gaps down tend to get filled
  • The Russell 2000 suffered one of its worst-ever days
  • The Russell fell into a bear market - what happens to the broader market
  • Energy stocks had the worst day since 1926
  • Those stocks are now down 50% from their 52-week high
  • A jump in new lows among indexes
  • A historic number of stocks on the Nikkei are oversold
  • What happens when Treasuries get this overbought on a monthly time frame
DATA &
TECHnologies
IndicatorEdge
‍
BackTestEdge
‍
Other Tools
‍
DataEdge API
RESEARCH
reports
Research Solution
‍
Reports Library
‍
actionable
Strategies
Trading Strategies
‍
Smart Stock Scanner
‍
FREE
RESOUrCES
Simple Backtest
Calculator
Simple Seasonality
Calculator
The Kelly Criterion
Calculator
Sentiment Geo Map
‍
Public Research Reports
‍
Free Webinar
COMPANY
‍
About
‍
Meet our Team
‍
In the News
‍
Testimonials
‍
Client Success Stories
Pricing
Bundle pricing
‍
Announcements
‍
FAQ
© 2024 Sundial Capital Research Inc. All rights reserved.
Setsail Marketing
TermsPrivacyAffiliate Program
Risk Disclosure: Futures and forex trading contains substantial risk and is not for every investor. An investor could potentially lose all or more than the initial investment. Risk capital is money that can be lost without jeopardizing ones’ financial security or life style. Only risk capital should be used for trading and only those with sufficient risk capital should consider trading. Past performance is not necessarily indicative of future results.

Hypothetical Performance Disclosure: Hypothetical performance results have many inherent limitations, some of which are described below. No representation is being made that any account will or is likely to achieve profits or losses similar to those shown; in fact, there are frequently sharp differences between hypothetical performance results and the actual results subsequently achieved by any particular trading program. One of the limitations of hypothetical performance results is that they are generally prepared with the benefit of hindsight. In addition, hypothetical trading does not involve financial risk, and no hypothetical trading record can completely account for the impact of financial risk of actual trading. for example, the ability to withstand losses or to adhere to a particular trading program in spite of trading losses are material points which can also adversely affect actual trading results. There are numerous other factors related to the markets in general or to the implementation of any specific trading program which cannot be fully accounted for in the preparation of hypothetical performance results and all which can adversely affect trading results.

Testimonial Disclosure: Testimonials appearing on this website may not be representative of other clients or customers and is not a guarantee of future performance or success.