
One of the worst 50 days for a new President

Key points:
- Stocks have not reacted well during the first 50 days since President Trump's inauguration
- After other poor reactions in the S&P 500 during the 50 days following inaugurations, stocks continued to struggle
- This contrasts strongly with times when investors were eager to buy, as those showed a strong tendency to persist
Political palpitations
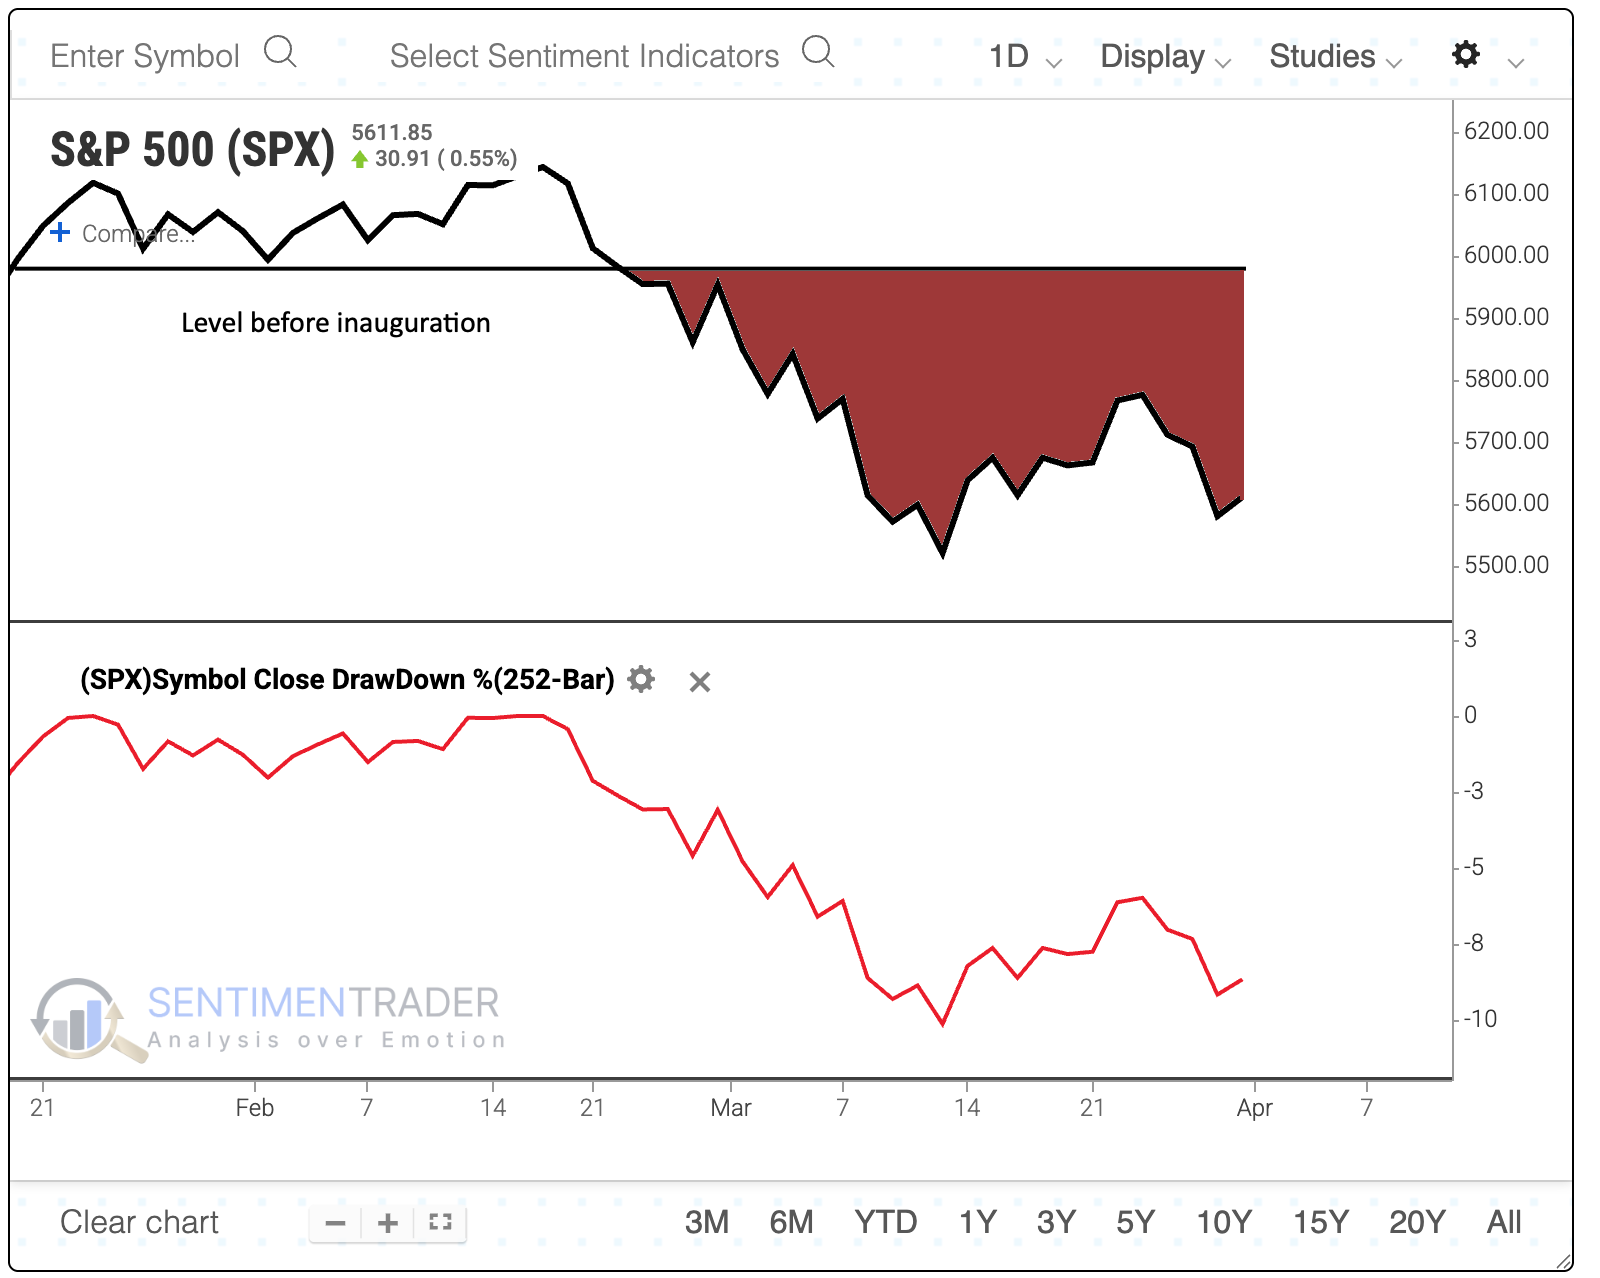
A couple of months ago, we saw that investors shouldn't short a dull President. Buyers tend to stick around when they are pretty comfortable with the initial administrative moves following an inauguration. The problem is that President Trump is anything but dull.
The most benchmarked equity index in the world fell below its level before the inauguration in late February and hasn't approached it since.
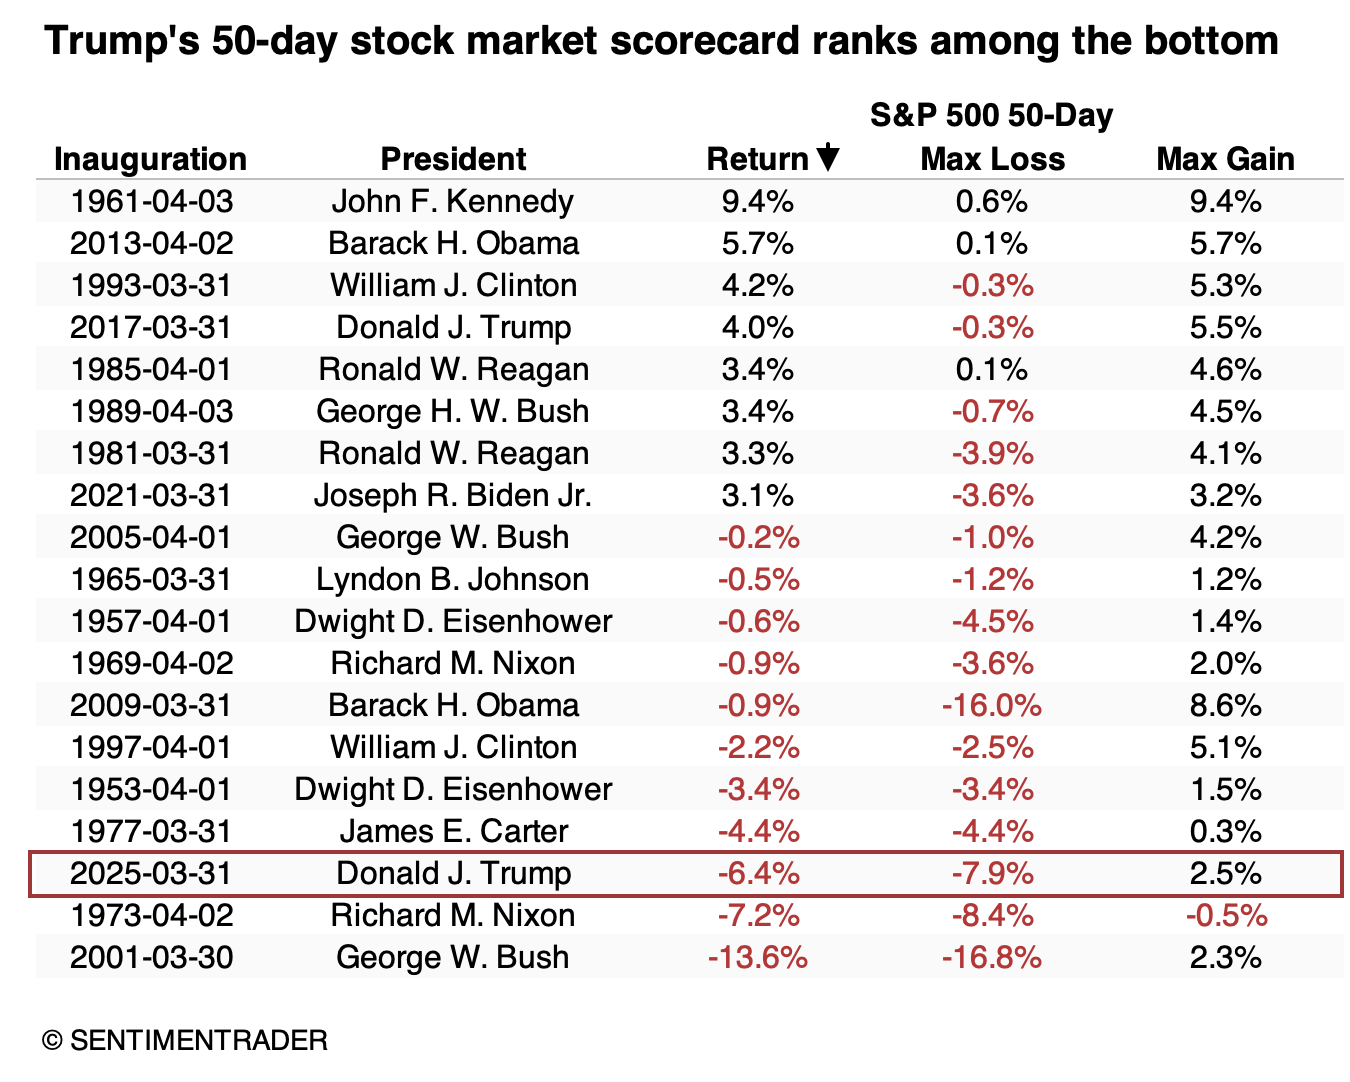
This reaction places the market's response to Trump's inauguration among the bottom of all Presidents since 1950. The table below shows the S&P 500's return in the 50 sessions following each inauguration, ranked from highest to lowest.
The market appeared to be thrilled with the initial moves of the Kennedy, Obama (2nd term), and Clinton (1st term) administrations, as much as we can correlate the stock market with politics. But the first term of Bush, 2nd term of Nixon, and now Trump were not received well. Trump's first 50 days rank 3rd from the bottom.
Poor reactions in the first 50 days are a bad omen
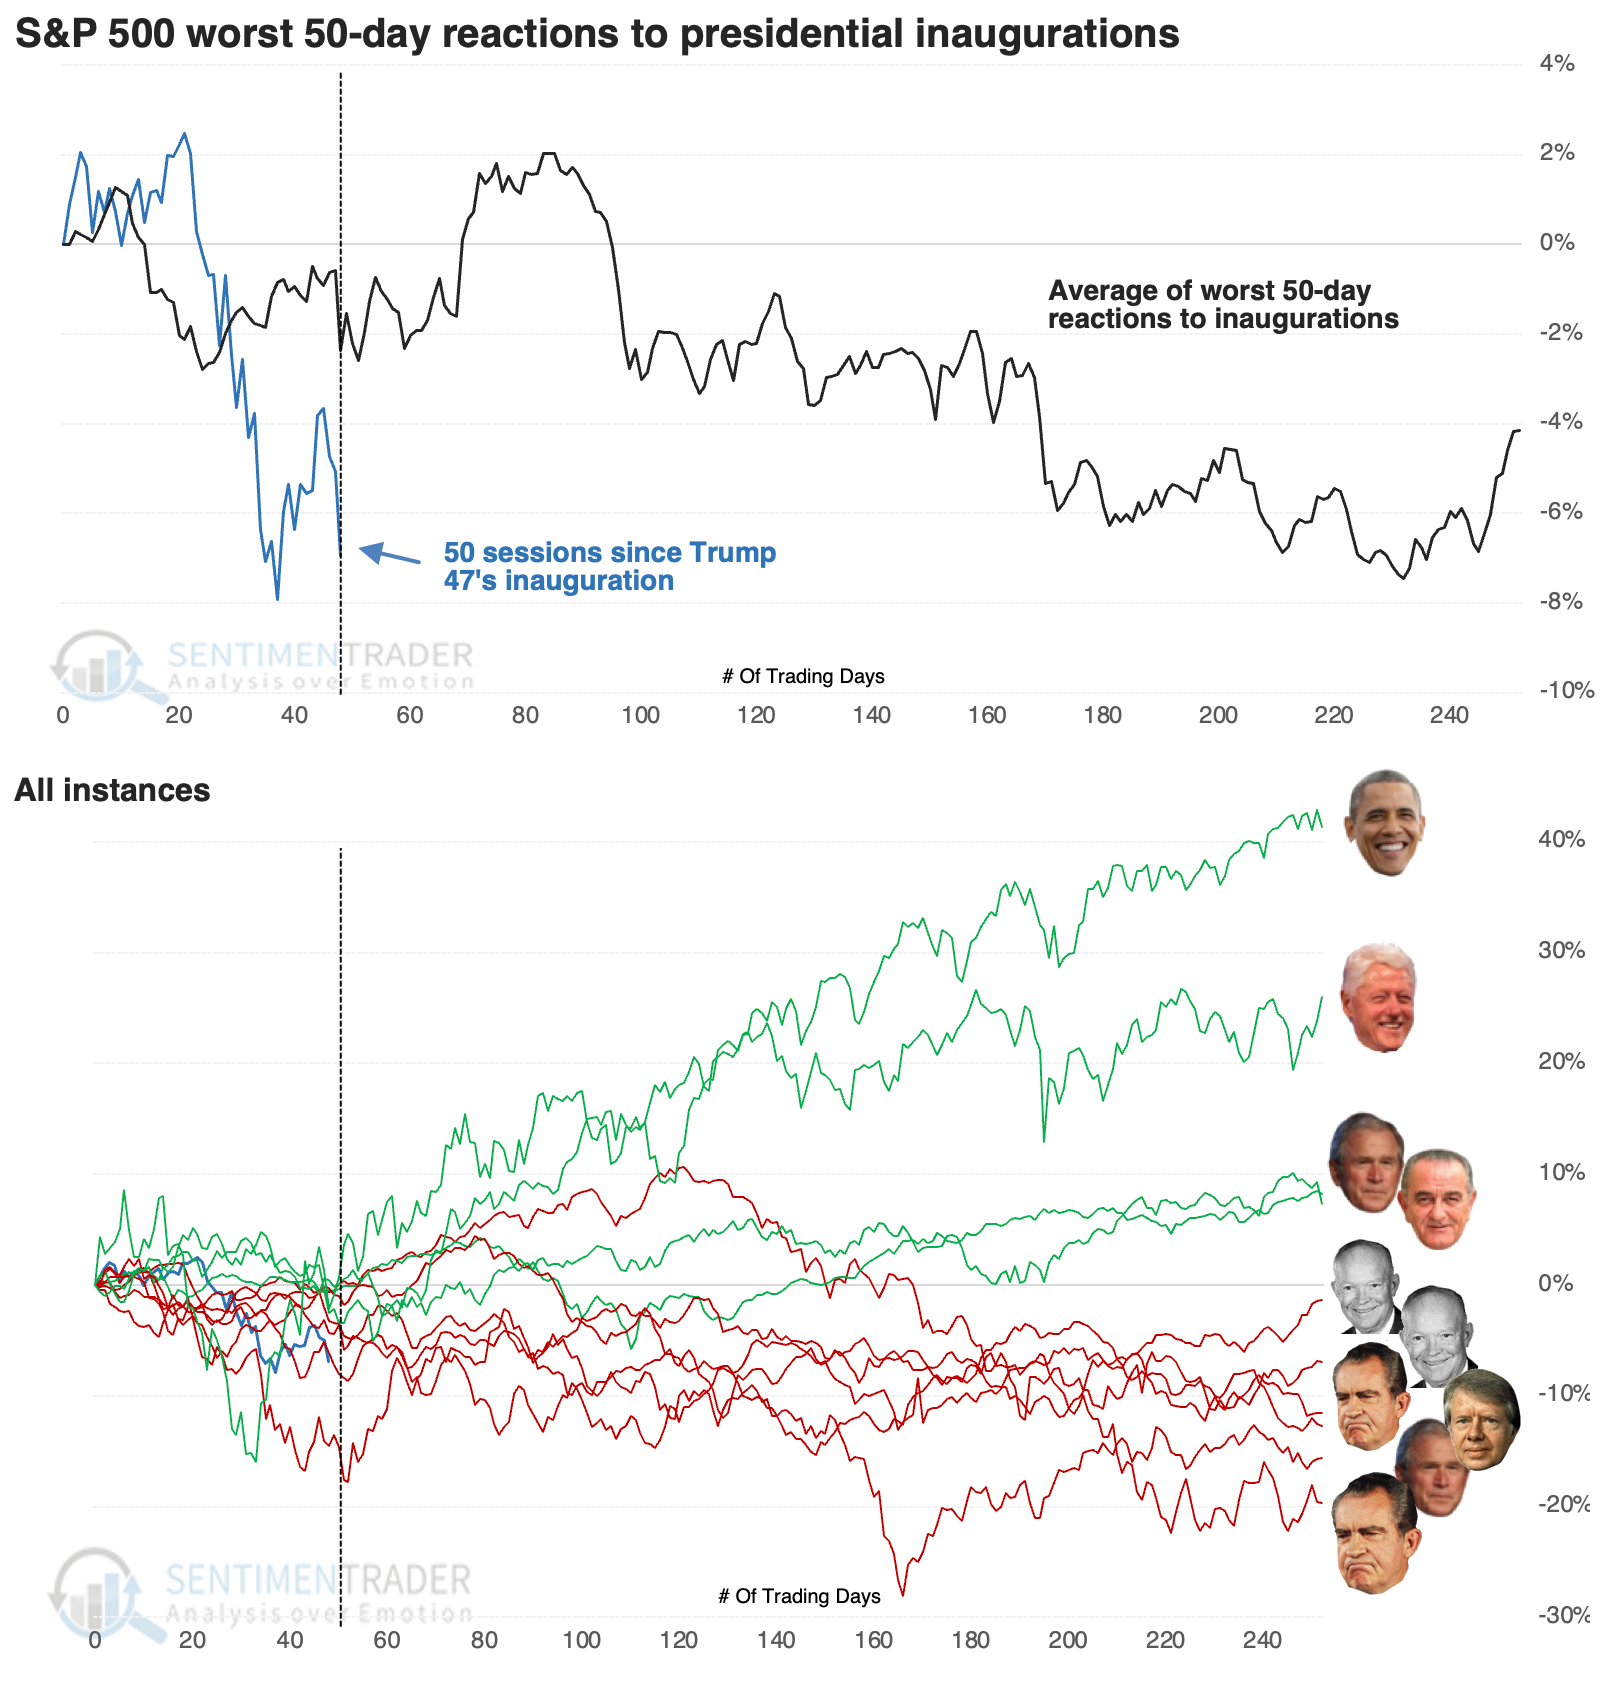
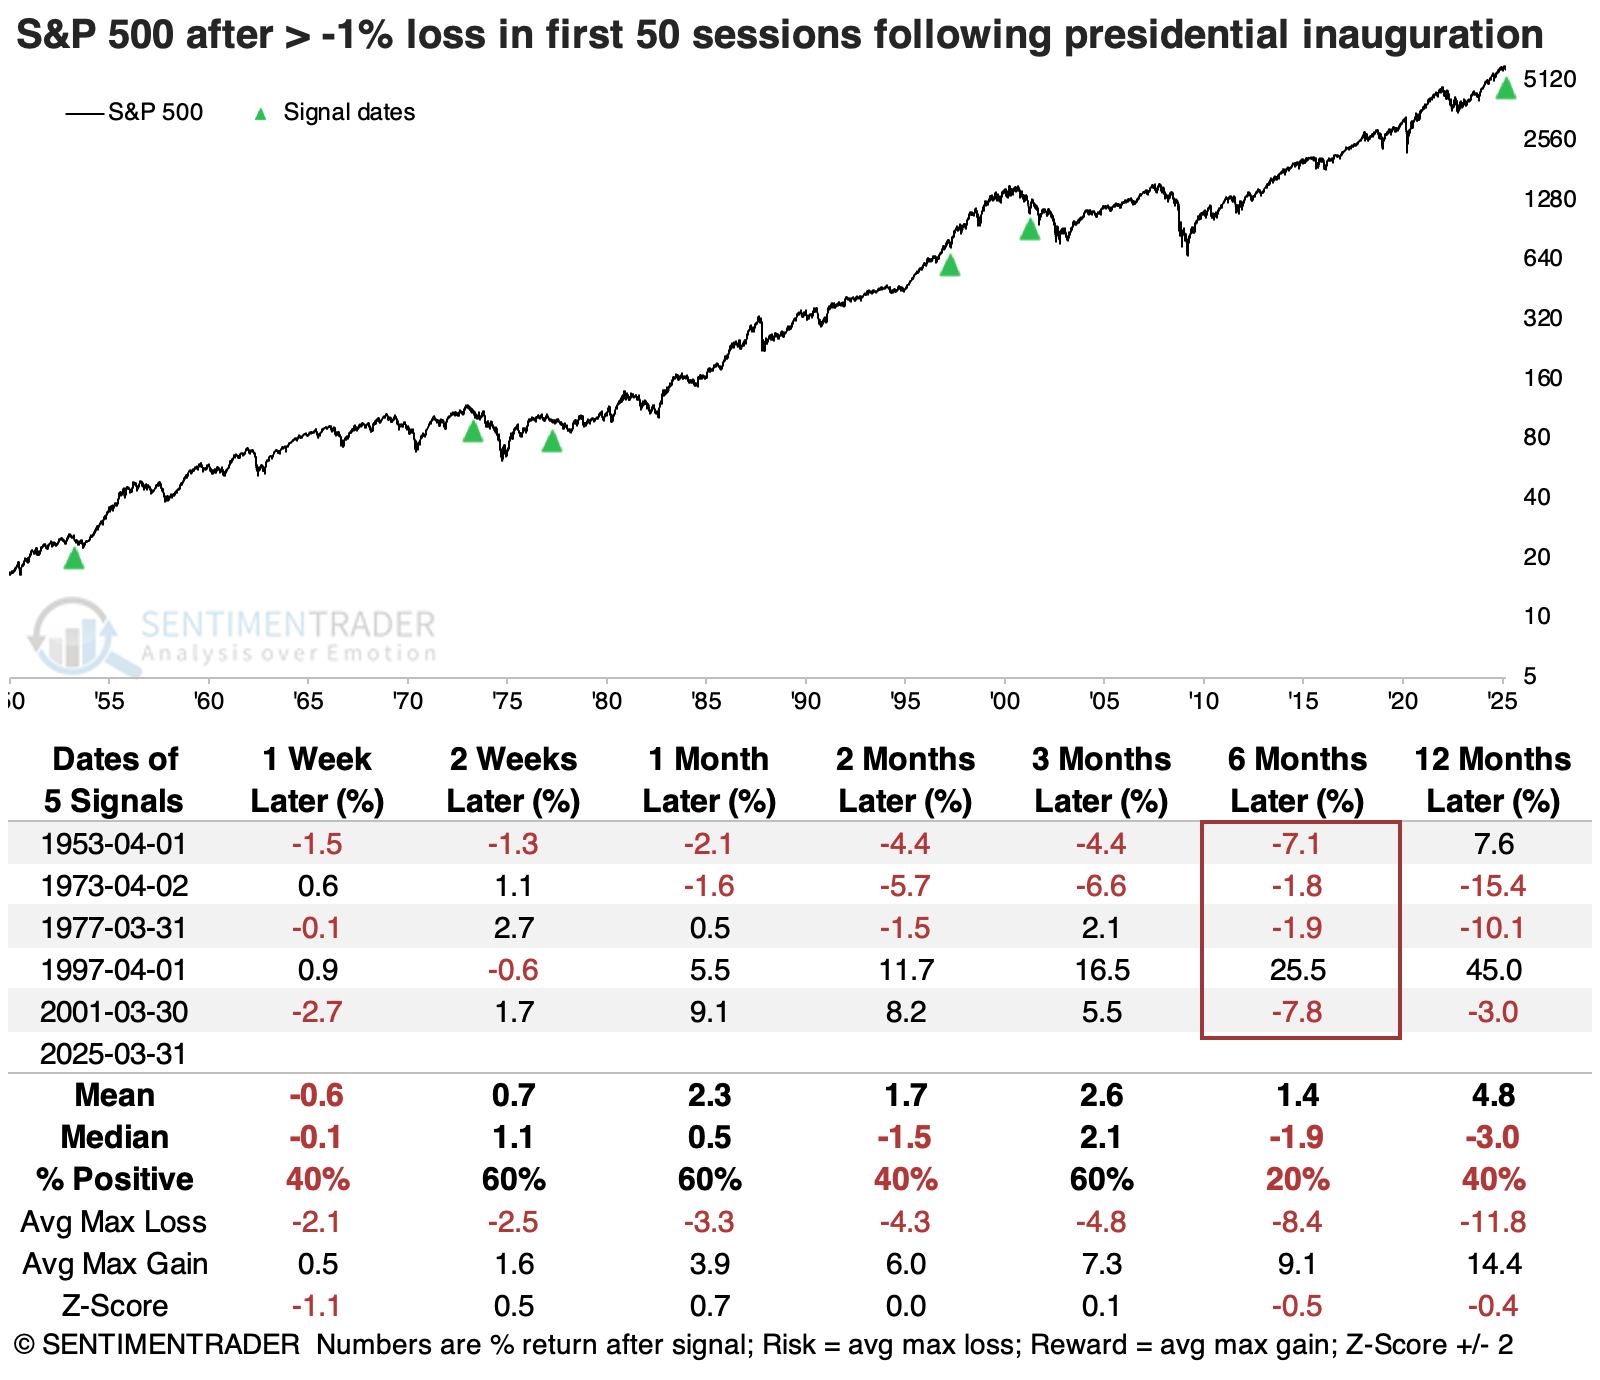
The chart below shows an aggregate and then individual price path of the years when the S&P 500 showed a negative return in the 50 sessions following an inauguration. The market recovered strongly in the cases of Obama and Clinton and did okay after Bush and Johnson. The others struggled to build on any gains.
The table below shows that the S&P's median return six months after those first 50 days was -1.9%, and even a year later, it was flat. Only four of the ten instances showed a larger maximum gain than loss over the following year.
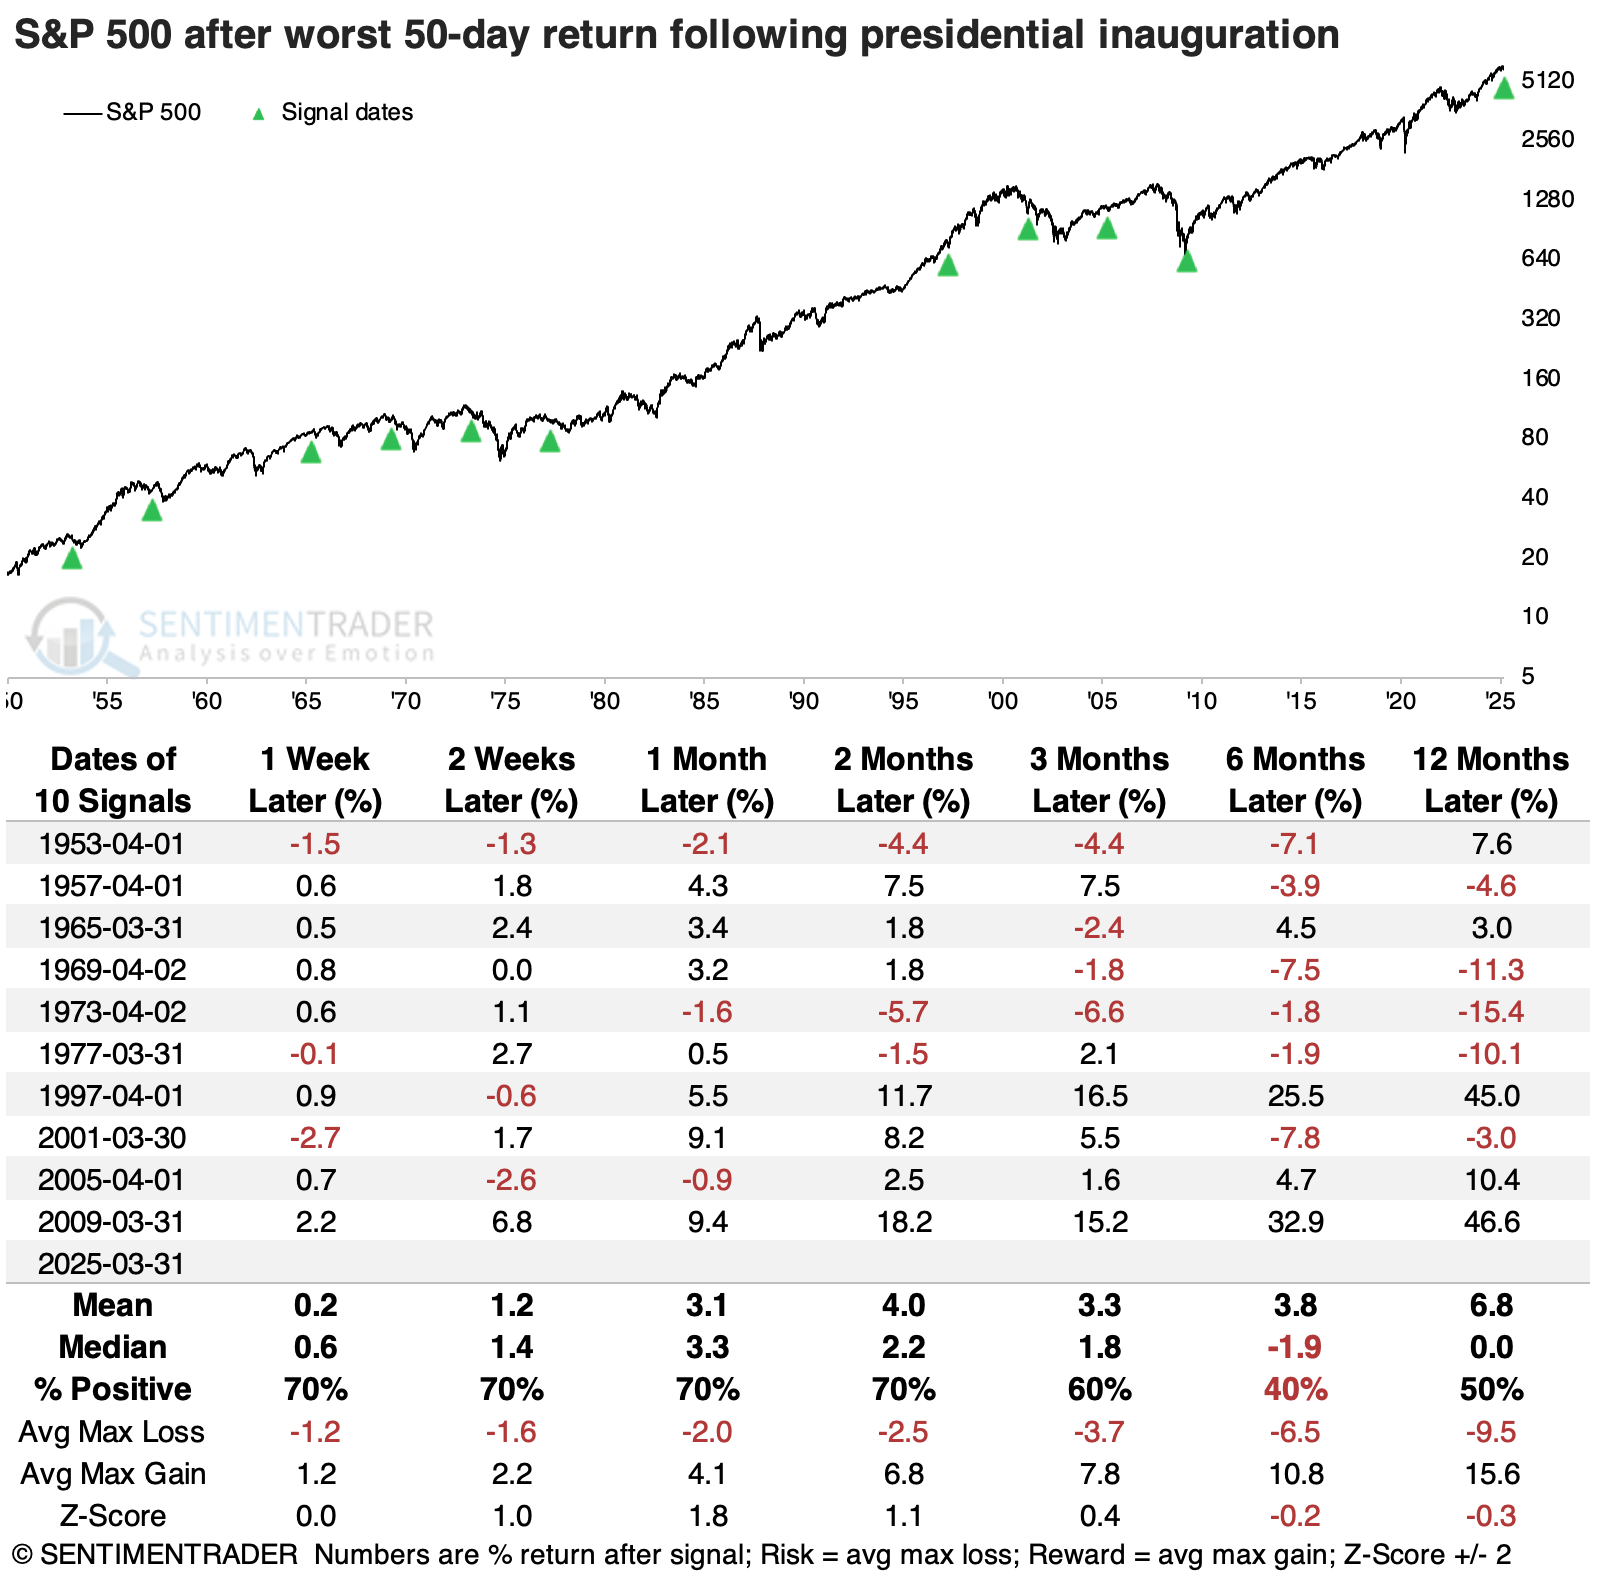
Half the instances in the table above were only minor losses during the first 50 sessions, -1% or less. Focusing on the most significant adverse reactions, we can see that only the inflating of the internet bubble during Clinton's second term avoided a loss for the index over the following six months.
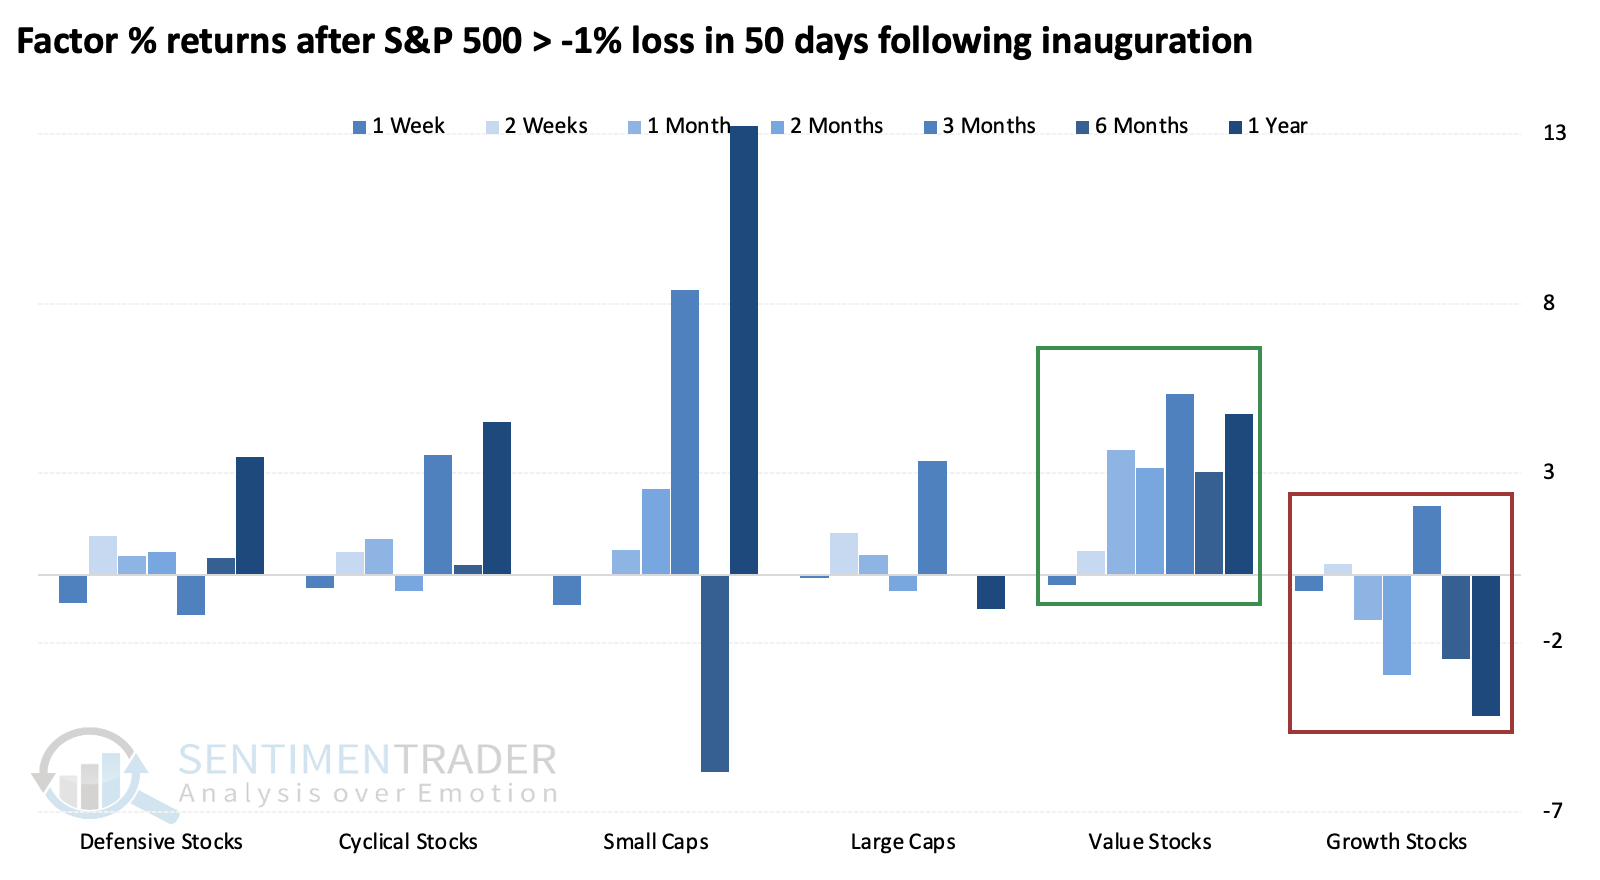
Sector returns were quite scattered after these years, but one standout was the value factor, which was higher a year later every time. Growth stocks, on the other hand, fared poorly across almost all time frames.
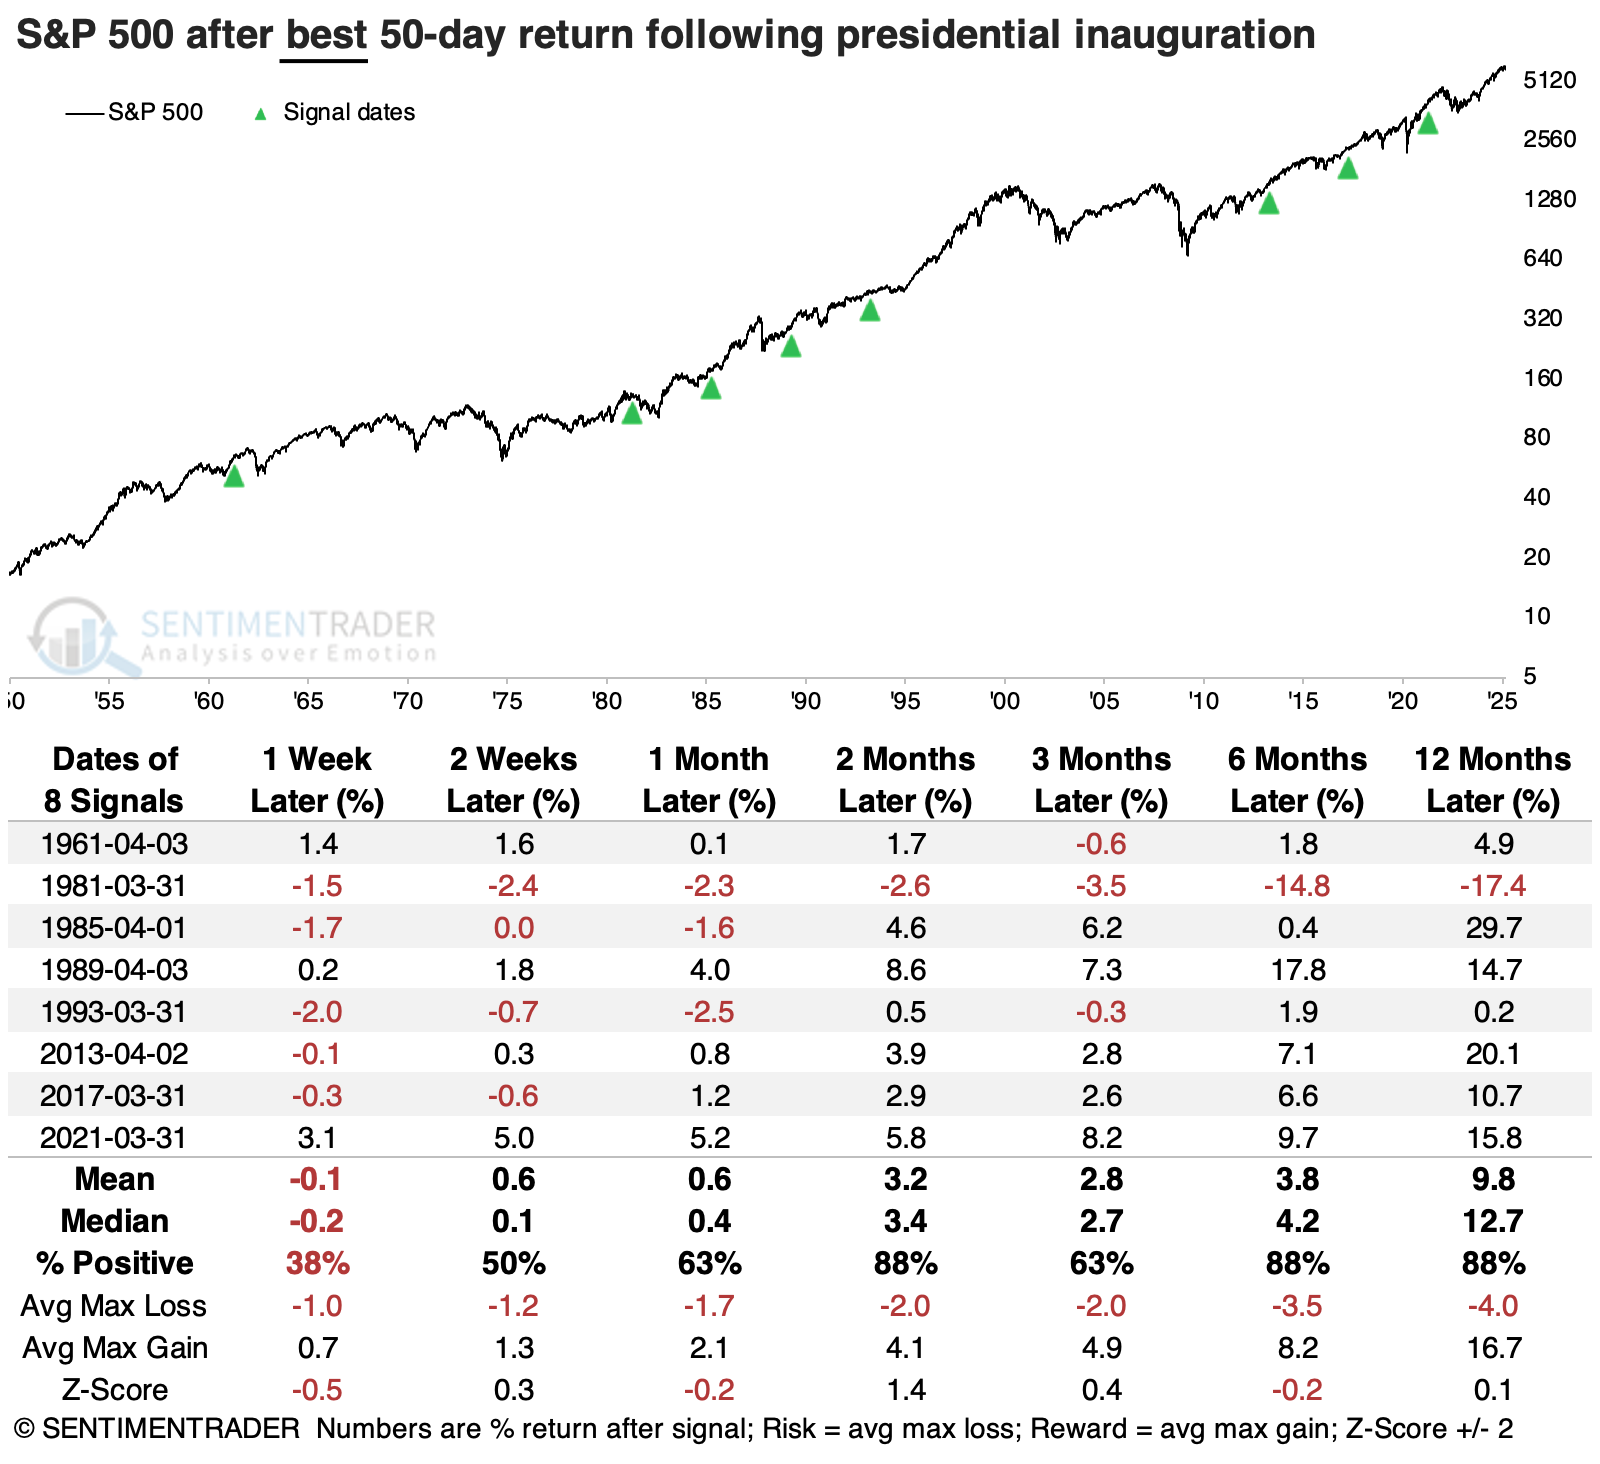
Contrast those returns with the years when the S&P showed the best reaction in the first 50 days following an inauguration.
Stocks jumped at the start of Reagan's first term, then fell as Volker raised interest rates to fight inflation, and the economy fell into a recession (ultimately forming a generational low). Other than that, stocks continued to build on the good starts and showed mostly solid gains over the following year. Only in 1981 did the S&P show a larger maximum loss than gain over the next year.
What the research tells us...
While it is generally foolhardy to assign political motives to stock movements, the correlation seems pretty clear in this case. The new administration's take on tariffs has not impressed the stock market, which overshadows what is perceived as a bevy of more business-friendly policies. Whether the tariffs will take effect in announced form is guesswork.
What is not guesswork is that arguably the most important index in the world has suffered during the halfway point of the first hundred days of the new administration. When investors have taken a negative tone during this stretch during other administrations, it has generally been an ill omen for the year ahead.