One More Reason to be Concerned about the Dollar
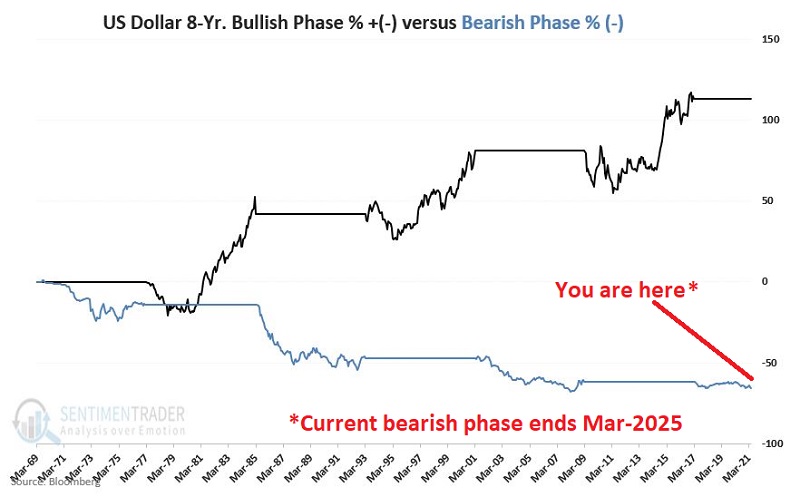
The U.S. Dollar has been in a pretty prolonged slump since spiking to a top in March of 2021. Any chance for a rebound? Sure, there is always a chance. The buck is pretty oversold, and trader sentiment - a contrarian indicator - is pretty darn negative. So, a "bounce" would not be entirely unexpected.
Still, a strong argument can be made that the dollar is in the midst of a longer-term decline.
THE U.S. DOLLAR 16-YEAR CYCLE
I read some years ago about a 16-year cycle for the U.S. dollar. Unfortunately, I can't remember where I read it, so I cannot give proper credit. The first full 16-year cycle - by my account - began on 3/31/1969 with an 8-year bearish phase, followed by an 8-year bullish phase.
- The "bearish" phase ran from 3/31/1969 through 3/31/1977
- the "bullish" phase ran from 3/31/1977 through 3/31/1985
- And so forth
Figure 1 displays the cumulative % growth achieved by holding a hypothetical long position in the U.S. dollar during all bullish phases (black line) and bearish phases (blue line).
Figure 2 displays the results by the numbers.
The latest phase - a bearish phase - began on 3/31/2017 and runs through 3/31/2025. Does that mean the dollar is doomed to decline relentlessly for another 4+ years? Not at all. However, it does tell us that it may be wise to favor the bearish side on any trade involving the U.S. dollar.
DIGGING A LITTLE DEEPER
Historically the most challenging time for the dollar is during June through December, when the 16-year cycle is in a bearish phase.
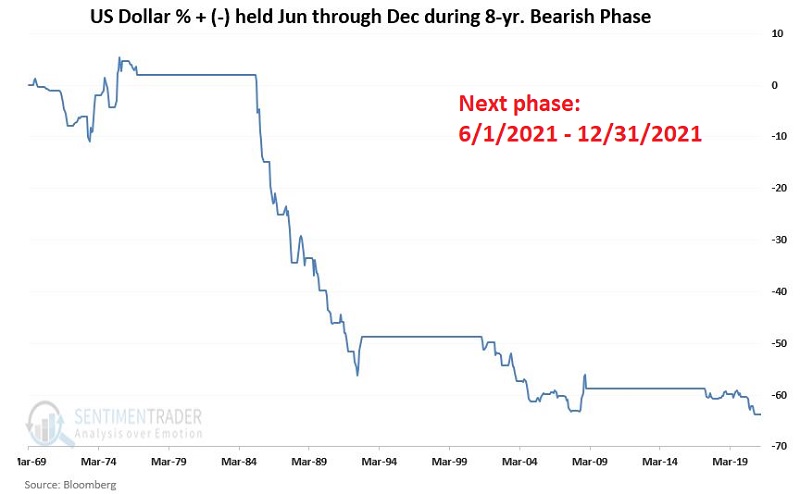
The chart below displays the cumulative % growth achieved by:
- Holding a hypothetical long position in the U.S. dollar
- ONLY during June through December
- During those years when the 16-year cycle is bearish
The next iteration of this particular "phase" begins on June 1st of this year and extends through December 31st.
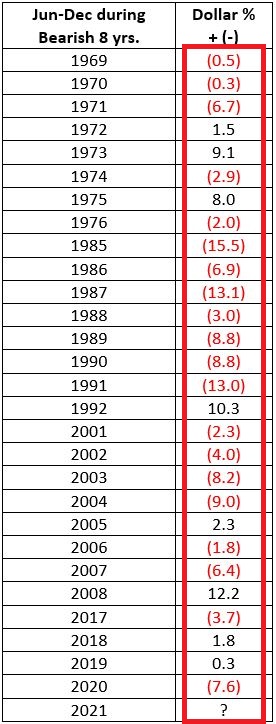
The table below displays the year-by-year results (i.e., the % gain/loss for the dollar during June through December ONLY during those years when the 16-year cycle is bearish).
This seven-month unfavorable period within the larger 8-year unfavorable period has shown:
- A gain 8 times
- A decline 20 times
- A 29% winning percentage
WHAT TO WATCH FOR
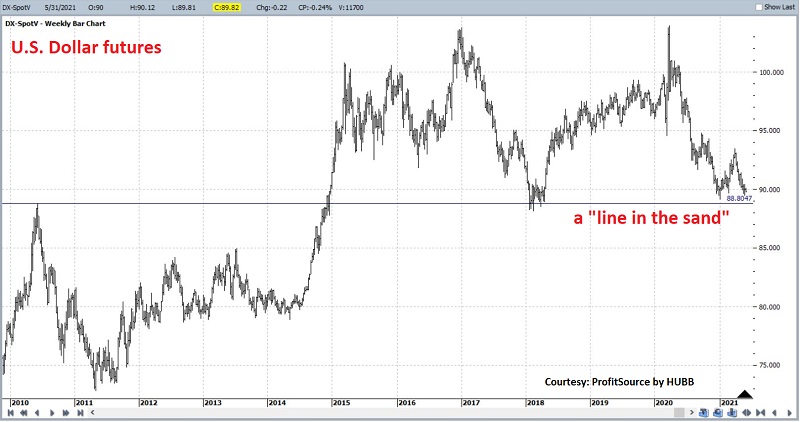
As you can see in the chart below (courtesy of Profitsource by HUBB), the dollar is nearing an important support level.
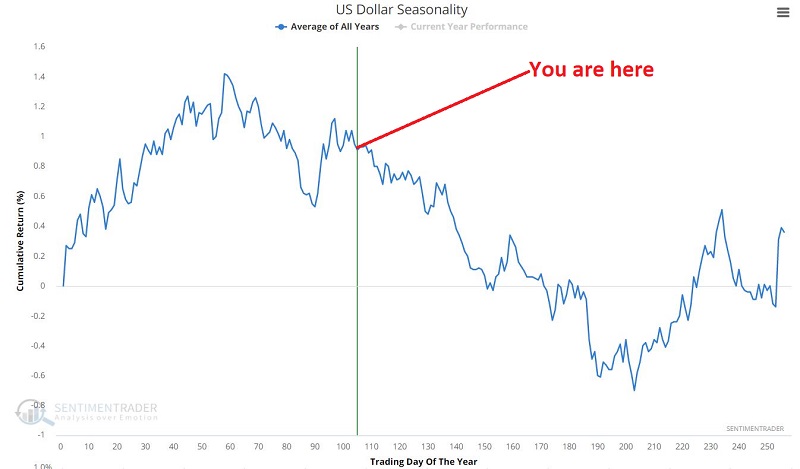
If the dollar breaks down through this level, then - based on the data above and the usual annual seasonal trend shown in the chart below - another significant down-leg becomes a strong possibility.
SUMMARY
There is absolutely nothing that requires the U.S. dollar to adhere to the 16-year cycle detailed above. But history suggests that getting bearish during the bullish 8-year phase and/or getting bullish during the bearish 8-year phase typically involves being willing to "swim upstream."
A large part of any investment success is "identifying the flow" and "going with the said flow." The dollar will remain in a bearish phase through March 2025. Therefore, history suggests that June-Dec of 2021, 2022, 2023, and 2024 may be a time to consider a bearish position regarding the buck.


