Products
SentimenTrader Trading Tools
‍
Backtest Engine
My Trading Toolkit
Correlation Analysis
Seasonality
Market Prediction
Indicators & Data API
‍
Proprietary Indicators & Charts
Market Data API
Strategies & Scanner
‍
50+ Trading Strategies
Smart Stock Scanner
Smart Option Scanner
Research Reports
‍
Research Solutions
Reports Library
Free Resources
Simple Backtest Calculator
Simple Seasonality Calculator
The Kelly Criterion Calculator
Sentiment Geo Map
Public Research Reports
Education
Sentiment Indicators
Technical Indicators
Pricing
Company
About
In the News
Testimonials
Client Success Stories
Contact
Log inLoginSign up
< BACK TO ALL REPORTS

One measure of inflation is collapsing at a historic rate

Dean Christians
2022-09-09
During the past five months, the ISM prices paid index collapsed by more than 34%, the fifth most significant decline in history. After similar contractions, stocks rallied 100% of the time a year later. Commodities struggled, which should help alleviate the high CPI numbers.

Key points:

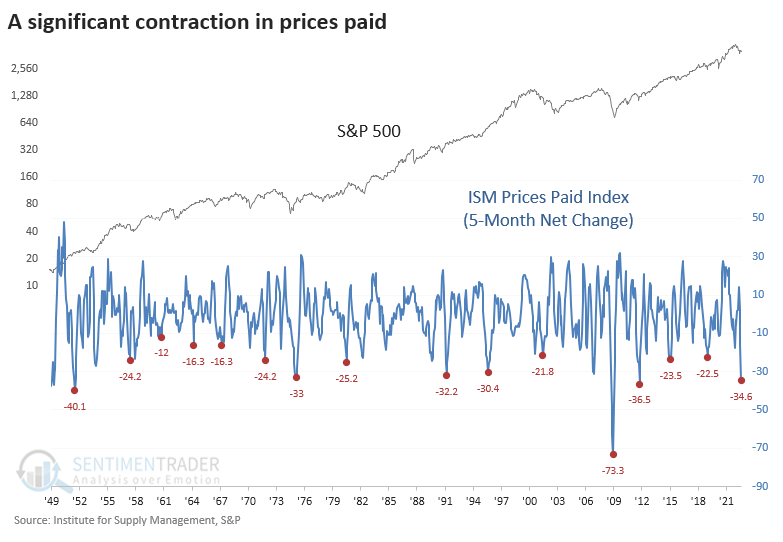
  • The 5-month net change for the ISM prices paid index has declined by over 34% 
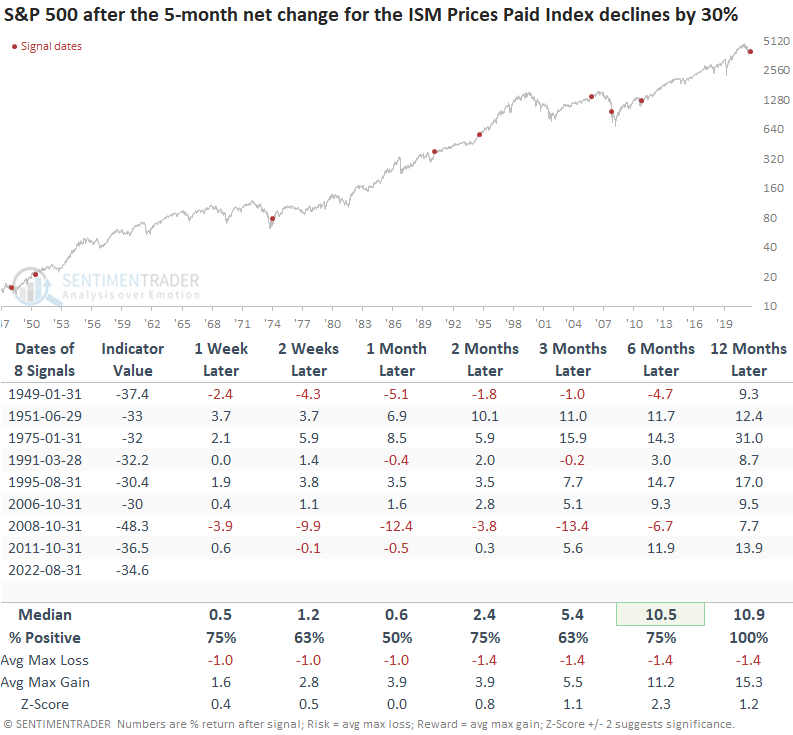
  • After similar contractions, stocks were higher 100% of the time a year later
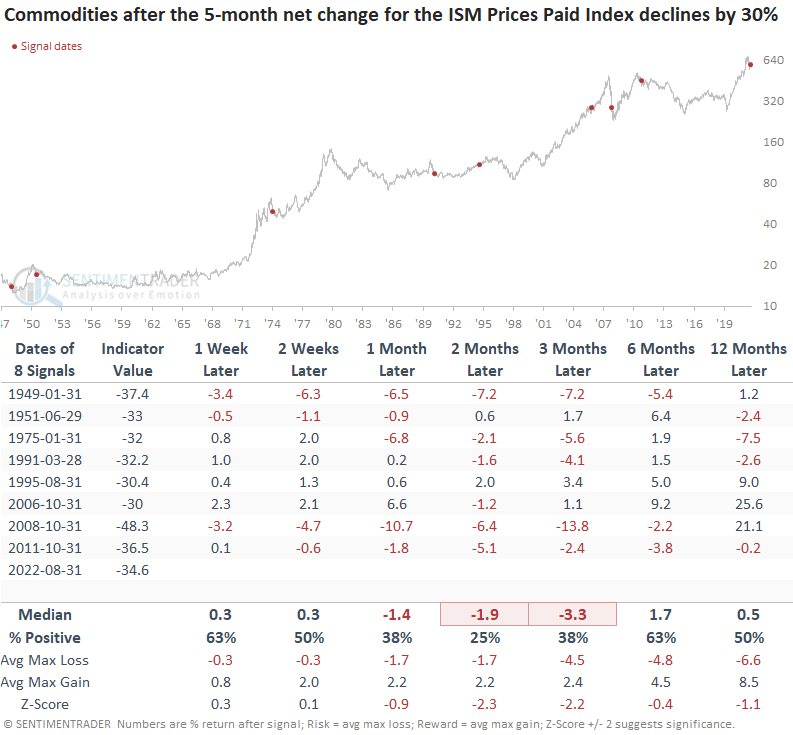
  • Commodities struggled, which should help with elevated consumer prices and bond yields

The manufacturing sector is seeing some relief in prices paid

Purchasing executives are reporting sharply lower prices for goods, and that bodes well for markets.

The Institute for Supply Management released the latest manufacturing data last week. While the overall survey has fallen in the previous few months, the prices paid index has fallen off a cliff. The index has declined by over 34% in five months, the fifth largest contraction in history.

Sharp contractions in the survey preceded positive returns for stocks

A sharp drop in the ISM prices paid index was bullish for stocks, especially on a medium to long-term basis. A year later, the S&P 500 was higher 100% of the time. The one untimely signal in 2008 occurred after the collapse of Lehman, a period when just about every risk asset was in freefall. 

On average, the S&P suffered minimal drawdowns within the next year while averaging a gain of more than 15% at some point.

Commodities tended to struggle after these signals

Commodities tend to suffer after a significant contraction in the ISM prices paid index, especially over the next one to three months. A year later, the median return was flat, with a win rate no better than a coin toss. The only times when the previous uptrends in commodities managed to sustain themselves were in 1995 and 2006.

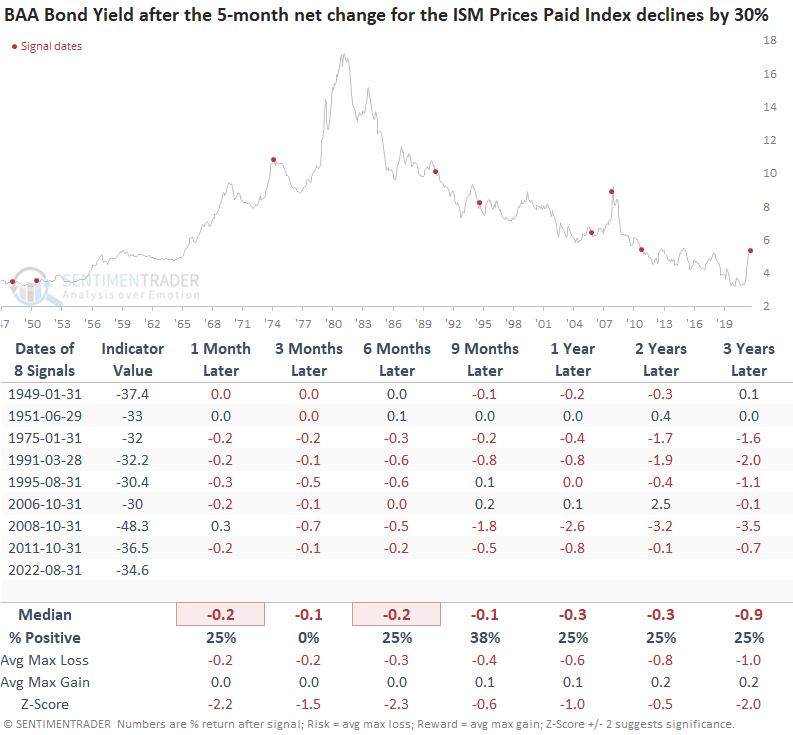
Corporate bond yields tended to fall

The contraction in the ISM prices paid index should help to bring down the cost of capital for corporations. Bond yields were lower in every instance three months later, even in 1975, which occurred in a high-inflation environment.

Expect some relief in traditional inflation measures

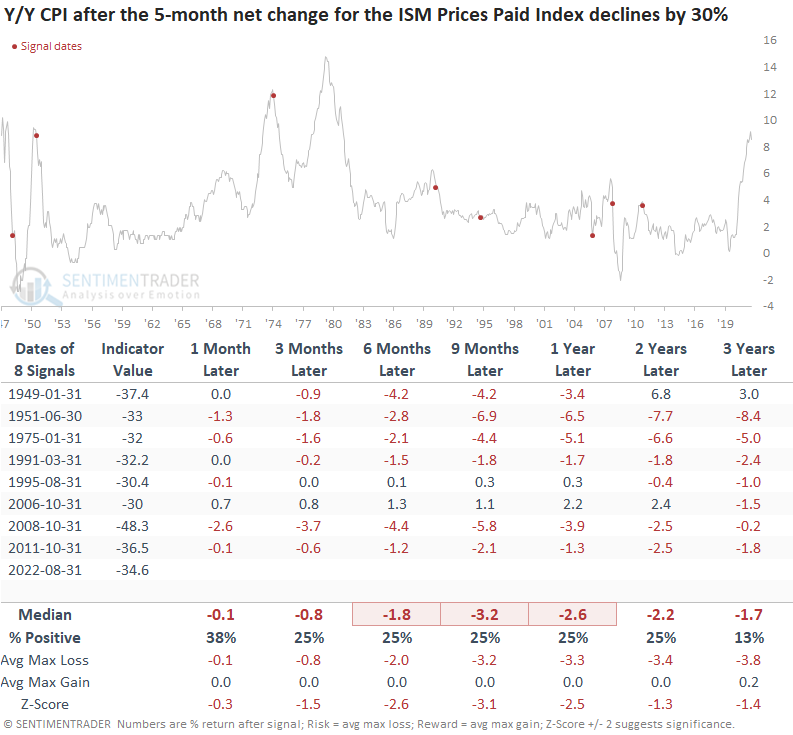
The significant contraction in the ISM prices paid index bodes well for some relief from elevated consumer prices.

Suppose we compare current-day Y/Y CPI to the other two extreme levels where we got a signal in 1951 and 1975. In that case, the collapse in the ISM prices paid index provided a timely alert for an impending contraction in CPI.

We must acknowledge that CPI components/weights have changed throughout history.

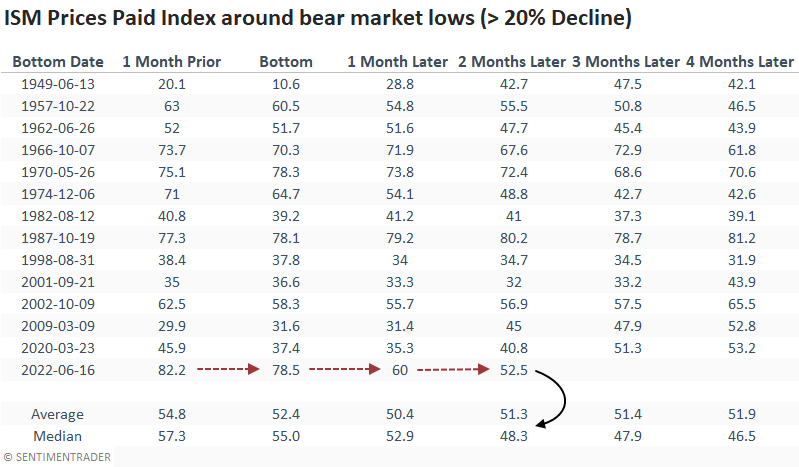
An assessment of ISM prices paid index around bear market lows 

The ISM prices paid index has now fallen to a level more in line with other historical periods around bear market lows. So, if June was the market low, stocks should have less of a headwind on a go-forward basis. 

What the research tells us...

Inflation has been the catalyst for one of the most aggressive tightening cycles by global central banks in history, and stocks have responded accordingly. The significant contraction in the ISM prices paid index is a positive development for stocks as it removes one significant macroeconomic headwind. While the decline is positive for stocks, it doesn't bode well for commodities, which should help alleviate the high Y/Y CPI numbers. With lower inflation, the environment for bonds looks more encouraging.

PRODUCTS
SentimenTrader
Trading Tools
Indicators & Data API
‍
Strategies & Scanner
‍
Research Reports
FREE
RESOUrCES
Simple Backtest
Calculator
Simple Seasonality
Calculator
The Kelly Criterion
Calculator
Sentiment Geo Map
‍
Public Research Reports
‍
Education
Sentiment Indicators
‍
Technical Indicators
‍
Pricing
Bundle pricing
‍
FAQ
‍
Announcements
‍
COMPANY
‍
About
‍
In the News
‍
Testimonials
‍
Client Success Stories
CONTACT
‍
General Inquiries
‍
Media Inquiries
‍
Financial Professionals Inquiries
‍
© 2026 Sundial Capital Research Inc. All rights reserved.
Setsail Marketing
TermsPrivacyAffiliate Program
Risk Disclosure: The information and tools provided are for research and analytical purposes only and are not intended as investment advice. Market analysis involves uncertainty, and outcomes may differ from expectations. Users should conduct their own due diligence and consider their individual circumstances before making any financial decisions. Past performance is not necessarily indicative of future results.

Hypothetical Performance Disclosure: Hypothetical performance results have many inherent limitations, some of which are described below. No representation is being made that any account will or is likely to achieve profits or losses similar to those shown; in fact, there are frequently sharp differences between hypothetical performance results and the actual results subsequently achieved by any particular trading program. One of the limitations of hypothetical performance results is that they are generally prepared with the benefit of hindsight. In addition, hypothetical trading does not involve financial risk, and no hypothetical trading record can completely account for the impact of financial risk of actual trading. for example, the ability to withstand losses or to adhere to a particular trading program in spite of trading losses are material points which can also adversely affect actual trading results. There are numerous other factors related to the markets in general or to the implementation of any specific trading program which cannot be fully accounted for in the preparation of hypothetical performance results and all which can adversely affect trading results.

Testimonial Disclosure: Testimonials appearing on this website may not be representative of other clients or customers and is not a guarantee of future performance or success.