
One measure of inflation has reversed higher

Key points:
- The ISM Prices Paid Index cycled from less than 45 to greater than 60
- After similar shifts, the S&P 500 exhibited a 94% win rate over the following six months
- Early cycle sectors like Discretionary and Technology outperformed the S&P 500
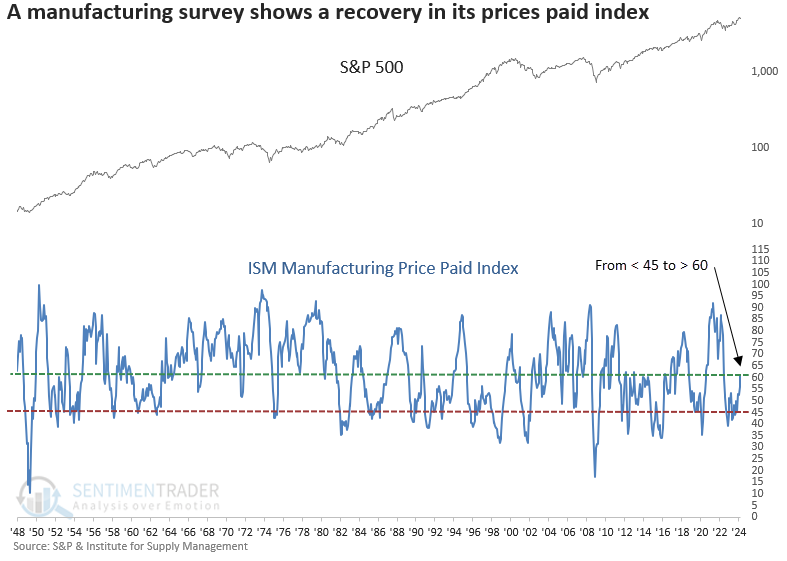
A purchasing managers survey shows a recovery in the prices paid component
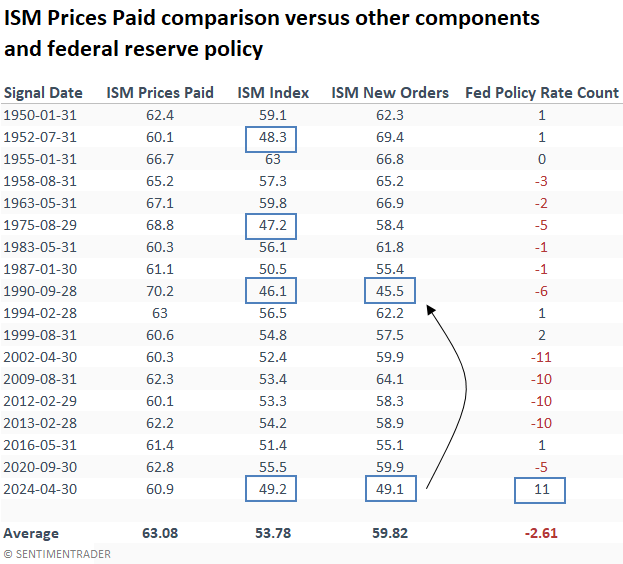
The Institute for Supply Management released its manufacturing survey on Wednesday. And while the overall index and the new orders component ticked down, disappointing expectations and falling back into contraction territory, the prices paid index continued to expand, rising by over five points in April.
The surge in the prices paid survey propelled the index beyond 60, marking a significant shift from its historically low position of less than 40, reached in December 2022, a level observed in only 6% of readings since 1948.
With inflation at the forefront of investors' minds, is it prudent to worry about the rebound in the prices paid index?
Similar recoveries in the prices paid index preceded a bullish outlook for stocks
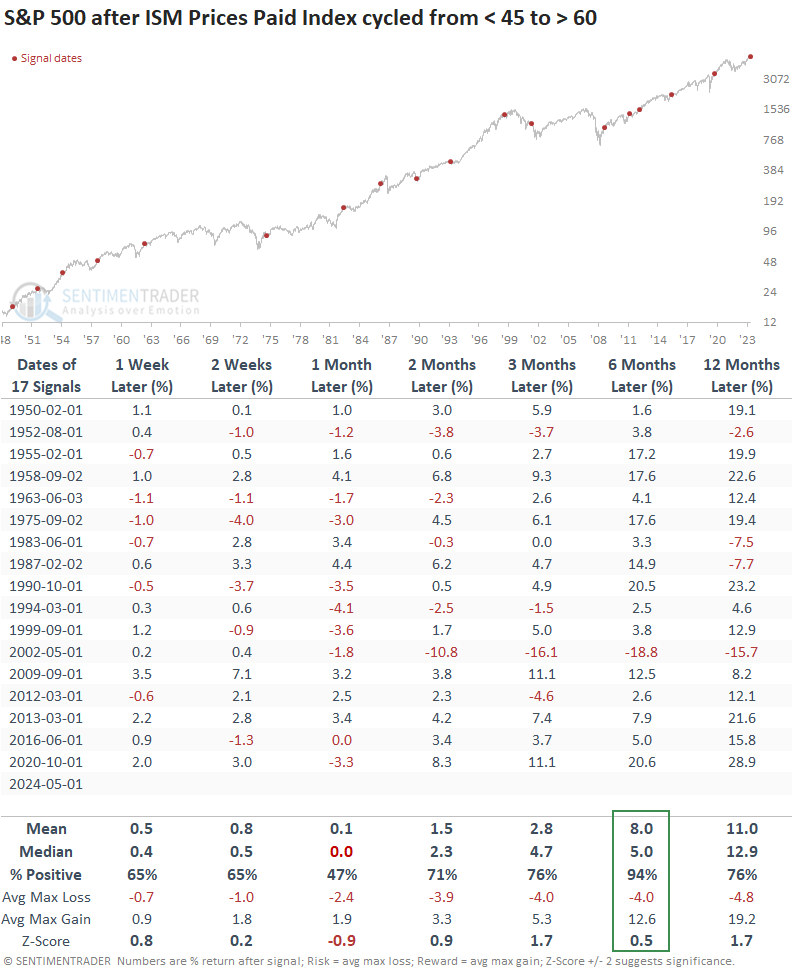
Whenever the ISM Prices Paid Index shifted from below 45 to above 60, the rebound in prices paid by manufacturing managers often aligned with an economic resurgence, bolstering the S&P 500.
Over the subsequent six months, the world's most benchmarked index rose in all but one scenario. That precedent occurred within the depths of a significant drawdown, which is not the case now.
The Institute for Supply Management publishes the survey data on the first business day of each month. So, I used the release date instead of the month-end date to provide a more realistic assessment. And a threshold of 45 instead of 40 increased the sample size.
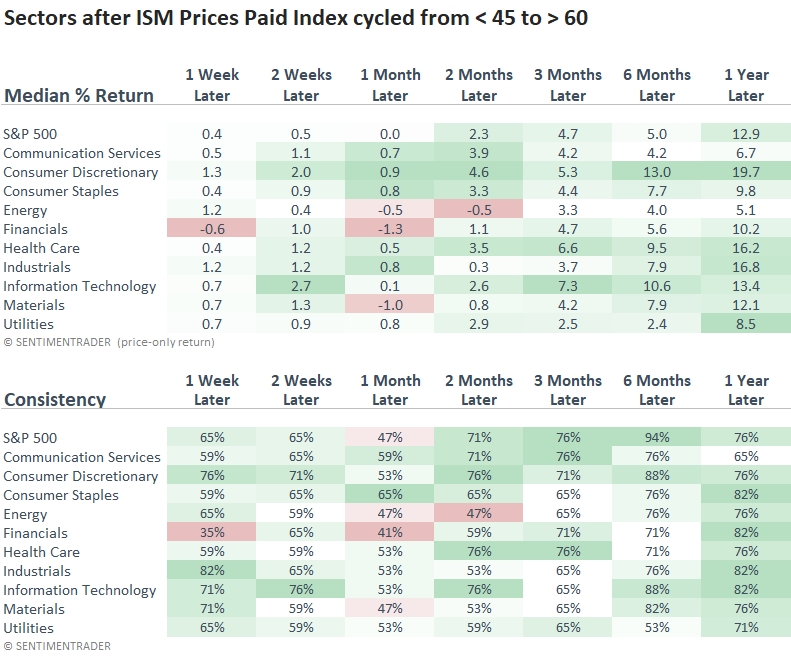
Sectors that tend to outperform in the early stages of an economic recovery, like Discretionary and Technology, exceeded the returns of the S&P 500 and other groups over the favorable six-month horizon.
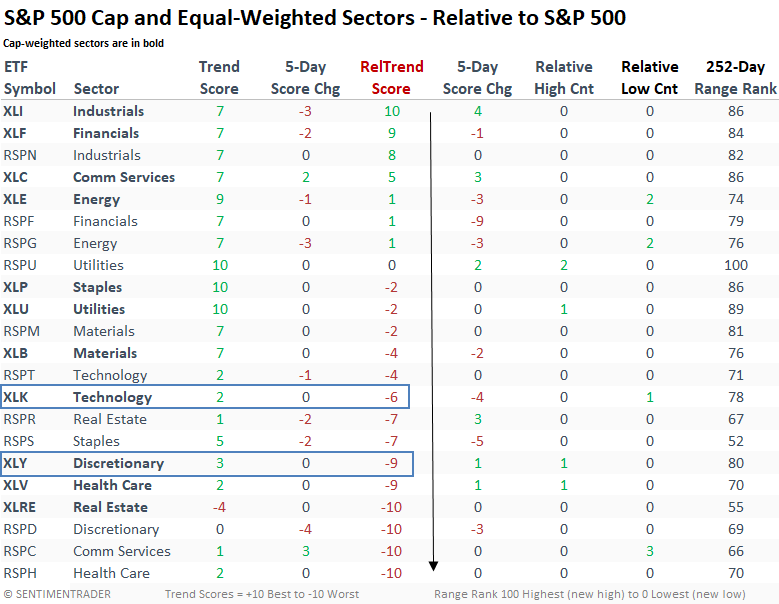
It's imperative to compare historical patterns with current trends. Although the Discretionary and Technology sectors have traditionally benefited from ISM Prices Paid Index recoveries, their present-day trend scores do not align with previous tendencies.
It's different this time
For only the second time in history, the ISM Prices Paid Index cycled from less than 45 to greater than 60, with both the overall ISM Index and the New Orders component in contraction territory. Usually, they ascend in unison after a contractionary period for manufacturing.
One reason for the divergence could be the Federal Reserve's policy stance. Typically, when these signals arise, the FOMC has been easing policy in response to soft economic conditions. However, that is not the case now, as evidenced by the unprecedented 11 interest rate hikes.
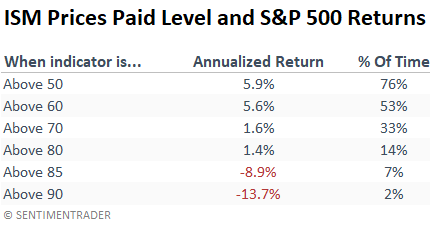
Suppose you were curious about the point at which the ISM Prices Paid Index reached an unfavorable threshold for stock returns. In that case, a reading above 85 produces negative annualized returns from the S&P 500.
What the research tells us...
The reversal higher in the ISM Prices Paid Index tends to coincide with a favorable shift in the manufacturing sector, often indicating an improving economic backdrop. Historically, such rebounds have preceded stock market gains, with the S&P 500 rising 94% of the time over the following six months. One issue with the current signal is that while the prices paid component is expanding, the overall index and new orders have failed to keep up and reside in contraction territory. One can't help but question whether this disparity signifies a late-cycle environment instead of an early-cycle one, which is typical of this signal. Adding weight to this narrative is the prevailing interest rate climate. Should the prices paid index rise above 85, investors should take note.