
One indicator that is bearish for bonds but bullish for financial stocks

Key points
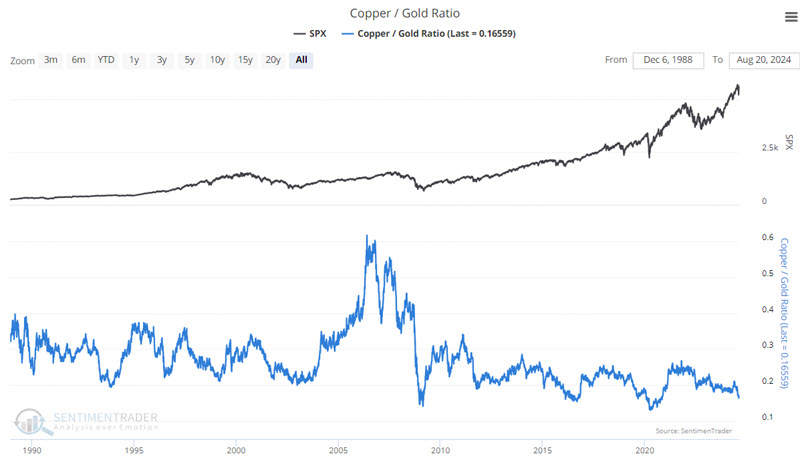
- The Copper/Gold Ratio compares the price of the leading industrial metal to the price of the leading precious metal
- This ratio is presently at a very low level historically
- Readings at this level have tended to be bearish for long-term bonds but bullish for financial stocks
The Copper/Gold Ratio is at a very low level
The Copper / Gold Ratio has been popularized by Jeffrey Gundlach, CEO of DoubleLine Capital LP. Note: Our calculation uses Copper and Gold Continuous Futures contracts. The chart below shows that the ratio currently stands at 0.16559.
Readings this low have tended to be followed by noteworthy performances in long-term treasury bonds and financial stocks. What is surprising is the polar opposite nature of the performance.
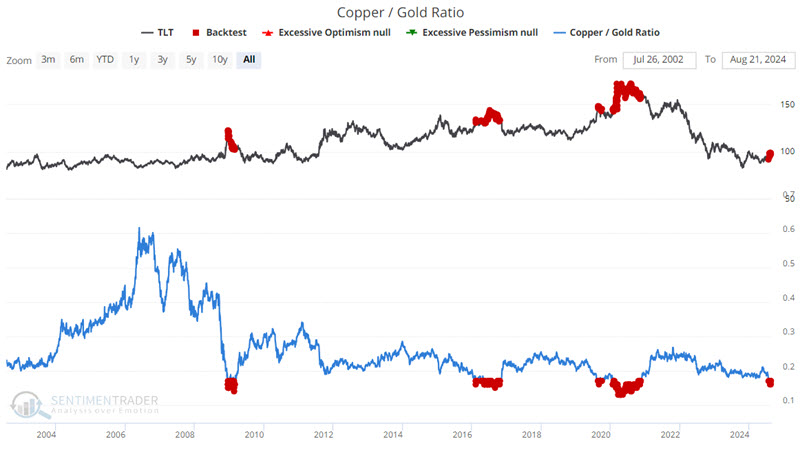
Long-term treasuries have tended to show weakness
The chart below highlights all dates when the Copper/Gold Ratio was below 0.17 versus the iShares 20+ Year Treasury Bond ETF (ticker TLT). Previous instances have occurred in 2008-2009, 2016, 2019, 2020, and now again in 2024.
The table below summarizes subsequent TLT performance following all dates highlighted in the chart above.
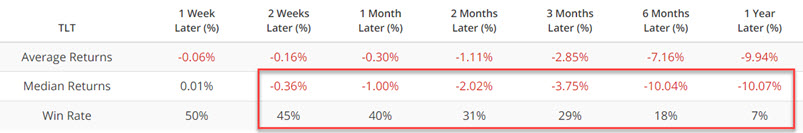
Interestingly, long-term treasuries are simply a proxy for (the inverse of) interest rates. That said, they have not performed well following Copper/Gold Ratio readings below 0.17. While we have not analyzed it closely, this suggests that low Copper/Gold Ratio readings tend to foreshadow higher interest rates.
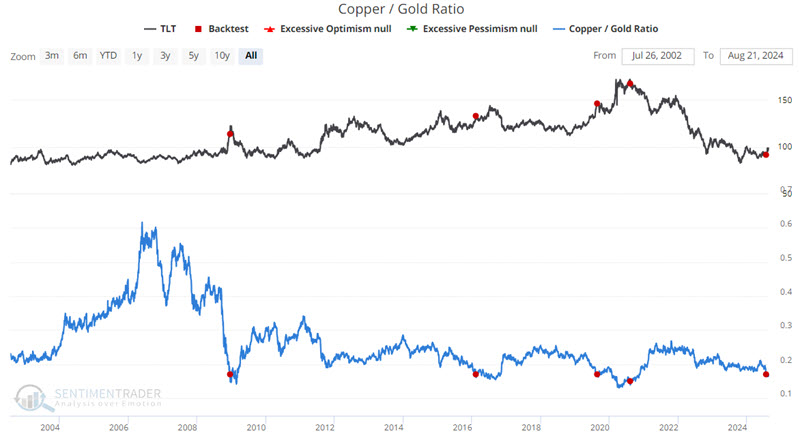
To remove some of the many overlapping signals, the chart below highlights only those dates when the Copper/Gold Ratio was below 0.17 for the first time in a year.
The table below summarizes subsequent TLT performance.
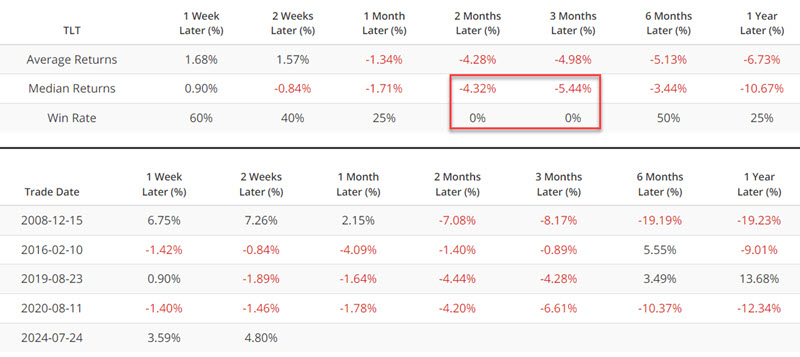
The overwhelming consensus is that the Fed is sure to cut interest rates in the year ahead, which would presumably boon long-term treasuries. The results in the table above suggest caution until there is some actual sign of real Fed action.
The financial sector tends to show just the opposite
Intuitively, one might presume that what is good for bonds is also good for the overall financial stock sector and vice versa. In reality, long-term treasury bond prices and financial stocks have tended to display an inverse relationship. That absolutely applies in the case of the Copper/Gold Ratio,
The chart below highlights all dates when the Copper/Gold Ratio was below 0.17 versus the Financial Select Sector SPDR Fund (ticker XLF).
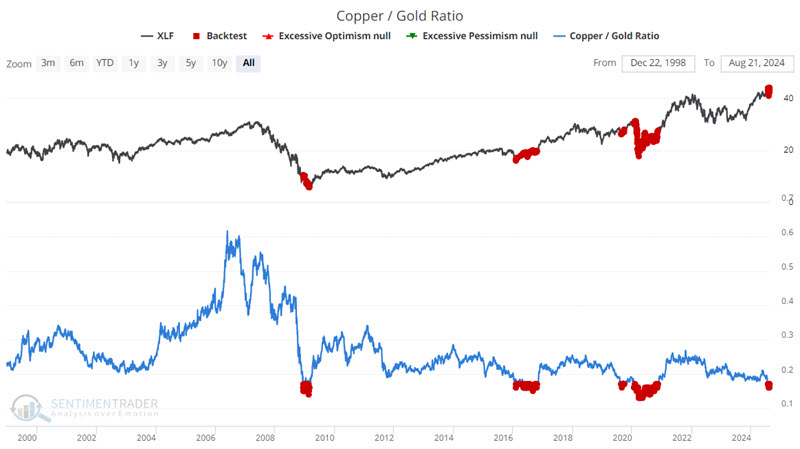
The table below summarizes subsequent XLF performance following all dates highlighted in the chart above.
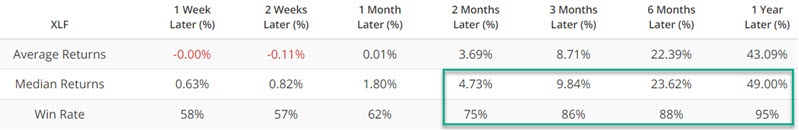
The problem with results like these is the tendency to fill one's eyes with stars. The correct message here is that the Copper/Gold Ratio is presently a favorable factor for financial stocks (one of many that can affect the financial sector). However, the mistake some might make is to assume that "there is a 95% probability of a 49% gain for XLF in the year ahead." Best advice: Give the bullish case the benefit of the doubt, but DO NOT make the most bullish assumption.
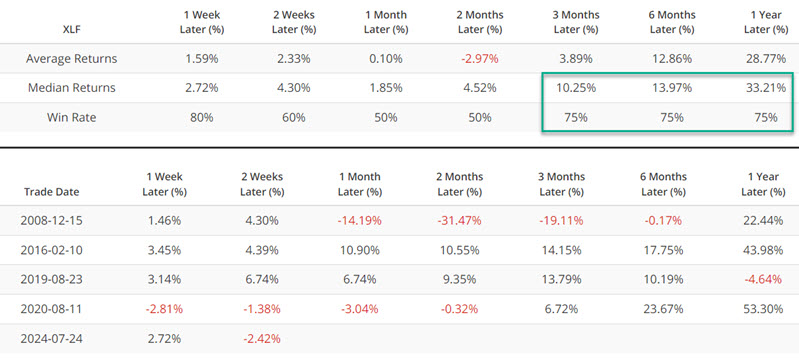
To remove some of the many overlapping signals, the chart below highlights only those dates when the Copper/Gold Ratio was below 0.17 for the first time in a year.
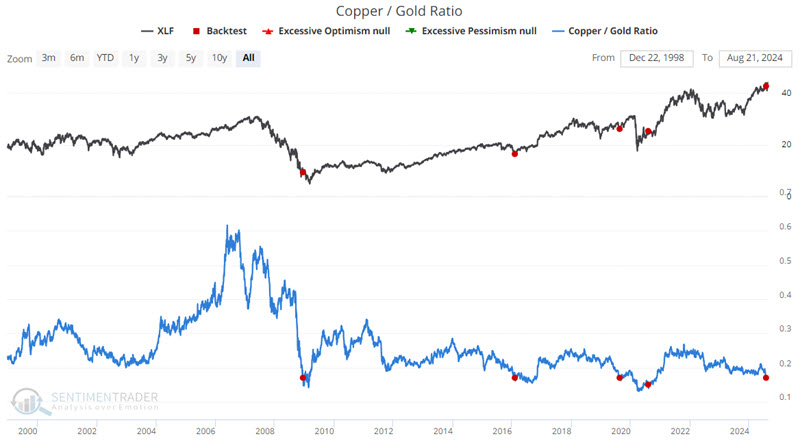
The table below summarizes subsequent XLF performance.
What the research tells us…
The price relationship between precious and industrial metals is not the only factor affecting the financial sector and bonds. So, we should be careful about assigning too much weight to its influence. That said, the results above are compelling. The bottom line: This one indicator is presently suggesting that investors give the bearish case the benefit of the doubt regarding long-term treasuries (at least until they establish an obvious uptrend) and give the bullish case the benefit of the doubt for the financial sector (again, with a close eye on price action confirmation).