
One employment indicator is flashing yellow for stocks and the economy

Key points
- Temporary employees are the easiest to hire and fire. Thus this data series tends to trend early in the business cycle
- Changes in the number of temporary employees appear to be a useful "canary in the coal mine" economic indicator
- This data series is also helpful as a stock market indicator
Analyzing temporary employee data
I recently updated a study on the number of individuals working as temporary employees. While we don't follow this series specifically on our website, I found the results compelling enough to discuss in detail.
The primary data series is available from this link at the St. Louis Federal Reserve website.
Note that the data for the previous month typically comes out early in the next month. For example, the data for January 2023 was released on February 3rd. Please note that for my analysis purposes, I analyze the latest data only at the end of each month. In other words, I assessed the January 2023 data released on February 3rd after the close on February 28th.
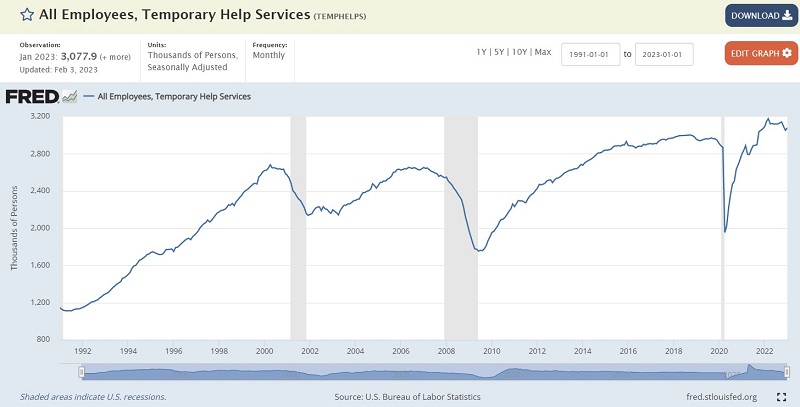
The chart below displays the raw data series from FRED, which tracks the number of individuals working as temporary employees in the latest survey of employers.
To determine the trend of the data, I apply a 10-month exponential moving average (EMA). The chart below displays the number of individuals working as temporary employees (black line) along with the 10-month EMA (blue line).
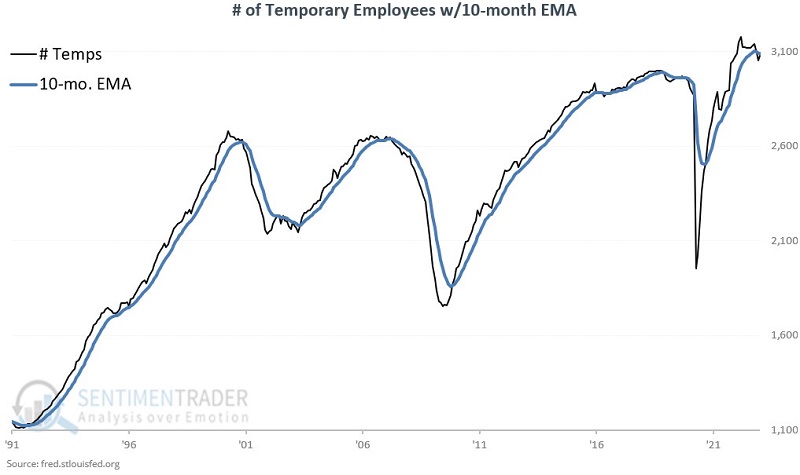
The TEMPS indicator is simple and calculated at each month's end as follows:
- If # Temporary employees > 10-month EMA, then the TEMPS indicator is rated as favorable
- If # Temporary employees < 10-month EMA, then the TEMPS indicator is rated as unfavorable
Note that the black line in the chart above is presently below the blue line in the chart above. As a result, the TEMPS indicator is currently rated as unfavorable.
Please note that I follow TEMPS as a "weight of the evidence" indicator (which presently falls on the bearish side of the ledger) and not as a trading system that generates automatic buy and sell signals.
TEMPS as an economic indicator
Hiring and firing temporary employees involve fewer regulatory and administrative hurdles for a company than full-time company employees. As a result, when things start getting tougher, one of the simplest things a company might do to cut expenses is to lay off temporary employees. As a result, the theory underlying the indicator detailed below is that the economy is in better shape if the number of temporary employees is above the 10-month EMA rather than below. As you will see below, this presumption appears to be highly accurate.
To measure the state of the economy, we will use the Coincident Economic Indicators (CEI), which can be found here. A rising trend in this series defines economic growth, and a declining trend defines an economic contraction or recession (recessions are highlighted in gray in the chart below). The raw data series appears in the chart below.
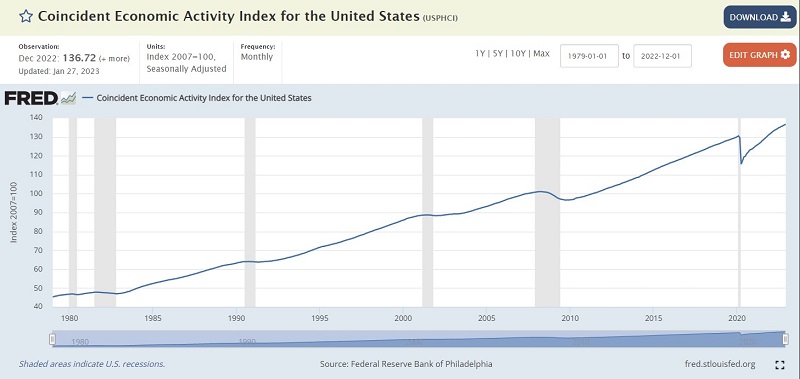
Note that the long-term trend is toward economic growth. Since 1991, monthly CEI readings have shown a month-to-month increase 91% of the time. This means the economy spent 9% of the time in the last 30+ years in recession (the gray periods in the chart above). So what does the TEMPS indicator do for us?
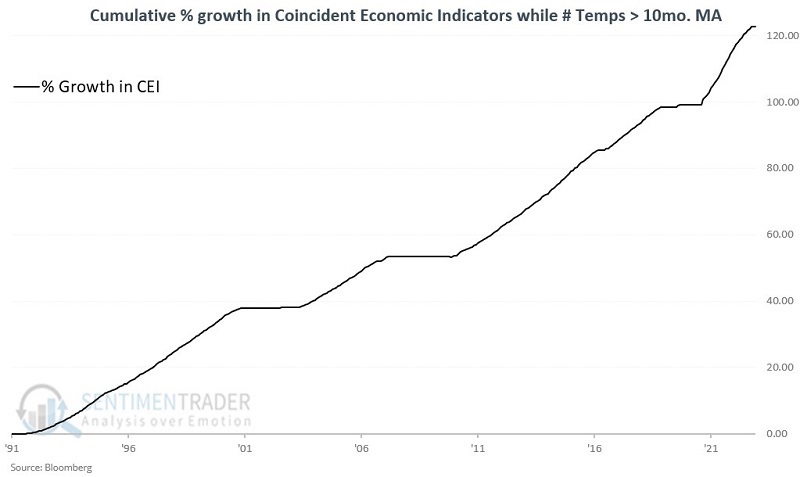
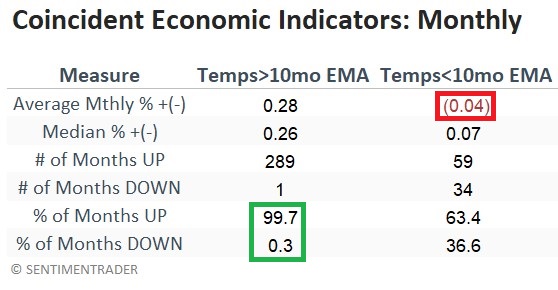
The chart below displays the cumulative percentage growth in the CEI only during those months when TEMPS is favorable (i.e., # of temporary employees closed the previous month above its 10-month EMA). Note the steady upward trend in economic growth. In fact, of the 290 months that saw the number of temporary employees > 10-month EMA, the Coincident Economic Indicators showed a gain in the following month 289 times (or 99.7% of the time).
On the other hand, the chart below displays the cumulative percentage growth in the CEI only during those months when TEMPS is unfavorable (i.e., when the # of temporary employees closed the previous month below its 10-month EMA). Note the hit-or-miss nature of economic growth during these periods. Also, note the stark contrast between this chart and the one above.
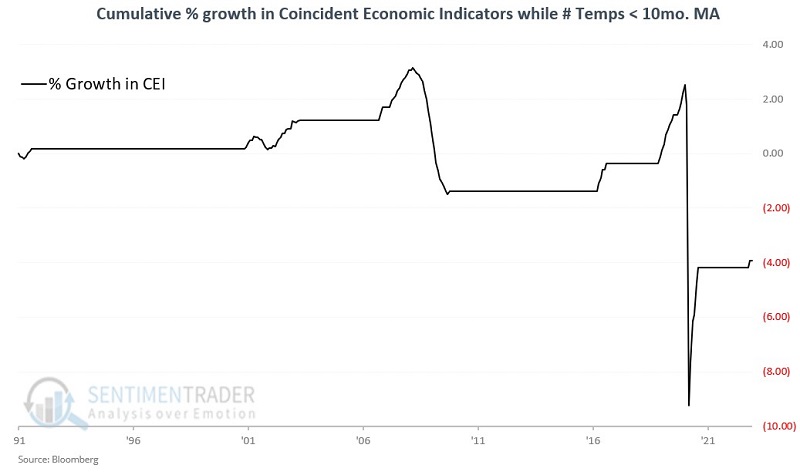
Of the 93 months when TEMPS was unfavorable, the Coincident Indicators showed a gain in the following month 59 times (63% of the time). This means that 37% of the time that TEMPS was unfavorable, the economy contracted in the following month, i.e., in recession.
The bigger picture item to note is that of the 35 months of economic contraction since 1991, 97% of those months occurred when TEMPS was unfavorable.
What TEMPS means for the economy
The bottom line is this: A recession is not a sure thing if TEMPS is unfavorable, but the odds are much greater. Conversely, if TEMPS is favorable, the odds of an economic recession have historically been nil. The table below tells the tale.
The measure as a stock market indicator
Forecasting the economy is interesting in an academic and business sense. However, as investors, our primary interest is in making money. So let's look at TEMPS as a stock market indicator.
The log scale chart below displays the growth of $1 in the S&P 500 Index only when TEMPS has been favorable since 1991.
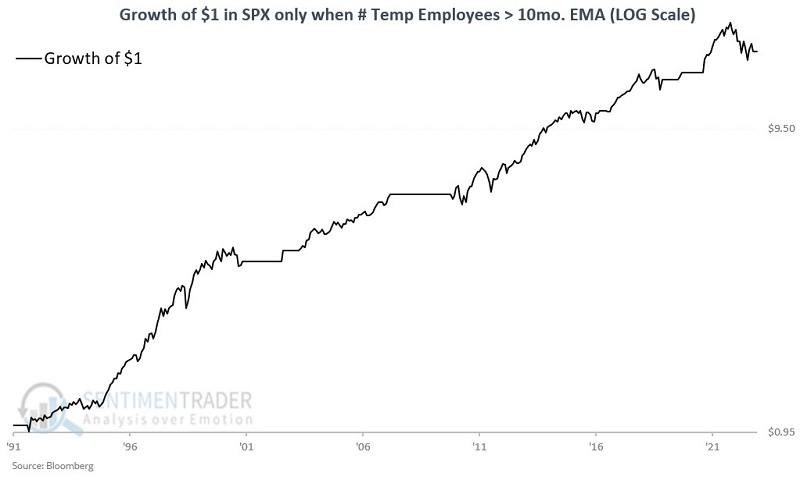 The cumulative growth during favorable periods since 1991 is +1,612%.
Conversely, the chart below displays the growth of $1 in the S&P 500 Index only when TEMPS is unfavorable.
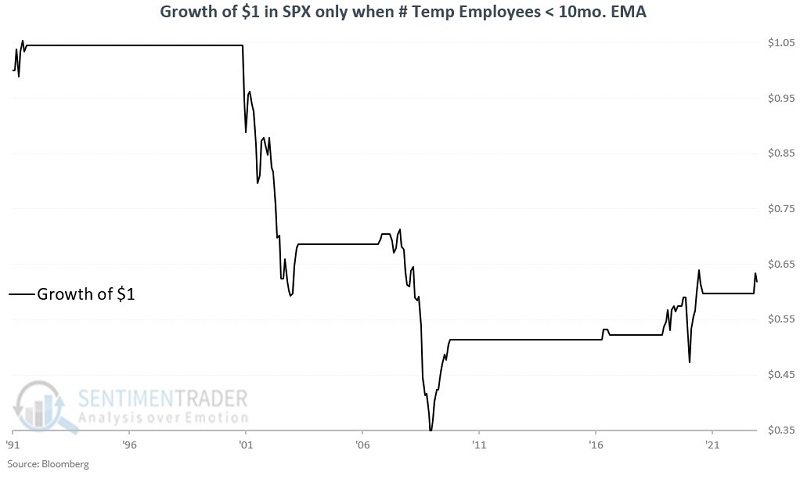
The cumulative decline during unfavorable periods since 1991 is (-38.2%).
What the research tells us…
The TEMPS indicator appears to gauge the potential for recession relatively well. If TEMPS is favorable, the probability of recession has been virtually nil. If TEMPS is unfavorable, then the potential for recession is much greater.
While this is valuable information, it is essential to remember that the stock market is a leading indicator of the economy and not the other way around. Fortunately, in this case, the TEMPS indicator also appears to be quite valuable as a stock market indicator. While TEMPS is not intended (at least by me anyway) to be used as an automatic trading system, its current unfavorable status is either a temporary blip - OR it counts as a cautionary "canary in the coal mine" alert to consumers and investors.