
One corporate insider model shifts down to neutral

Key points
- Corporate insiders went on a buying spree in 2022, correctly foreshadowing the bull market of the past two years
- In the latest week, our Corporate Insider Buy/Sell Ratio fell far enough to offset the bullish implications - which can last for up to three years after an initial bullish signal
- At the end of this week, my own corporate insider model will move from favorable to neutral
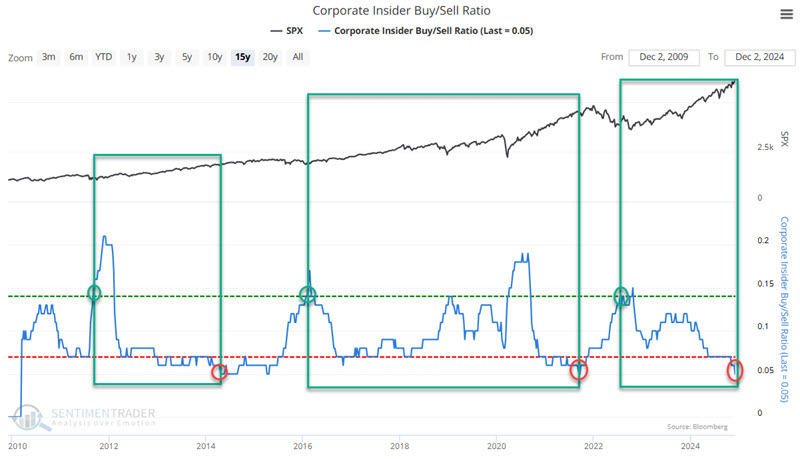
The Corporate Insider Buy/Sell Ratio
In this article dated 2024-10-16, I wrote a detailed report about a simple model that I follow to designate the action of corporate insiders as either "favorable" or "neutral." The model is not explicitly intended to be a standalone trading model. However, it applies specific rules to make the interpretation of insider activity somewhat more systematic.
First, note that the "model" below does not give "buy" and/or "sell" signals per se. Instead, at any given time, it is rated as "favorable" or "neutral." When the status is "favorable," it suggests that investors should be aggressive in playing the long side of the stock market. When the status is "neutral," investors should take no inference either way.
Our insider database is updated weekly on Monday (except for a market holiday). However, we will review the latest week's data at the close of the current week's trading (typically Friday).
The rules:
- If the Corporate Insider Buy/Sell Ratio is reading 0.14 or higher, the model status is considered "favorable" for stocks
- Once the model reaches "favorable" status, it maintains a "favorable" rating until:
- The Corporate Insider Buy/Sell Ratio touches a reading of 0.05, OR
- 156 weeks (i.e., three years) since the last 0.14 or higher reading goes by
On Monday, 2024-12-02, the model fell to 0.05. At the end of this week, the model will switch from "Favorable" to "Neutral."
The chart and table below highlight the favorable periods and S&P 500 results.
The table below displays S&P 500 performance during the favorable periods highlighted above.
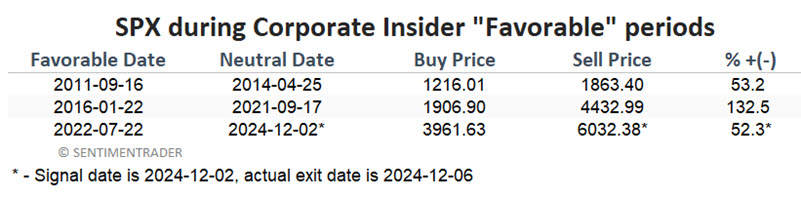
The first favorable period began on 2011-09-16, when the ratio rose to 0.14, and ended on 2014-04-25, when it fell to 0.05. During those 31 months, the S&P 500 gained +53.2%. Over the next 21 months, while the model was "neutral," the S&P 500 gained +2.3%.
The second favorable period began on 2016-01-22, when the ratio rose to 0.14, and was extended when it rose above the 0.14 level in 2019 and 2020. The favorable period ended on 2021-09-17 when the ratio fell to 0.05. During these 68 months, the S&P 500 gained +132.5%. Over the next ten months, while the model was "neutral," the S&P 500 lost 10.6%.
The third and most recent favorable period began on 2022-07-22, when the ratio rose to 0.14. The indicator fell to 0.05 on Monday of this week, so the model will return to "neutral" status at the close of 2024-12-06. Through 2024-12-02, the S&P 500 has gained 52.3%.
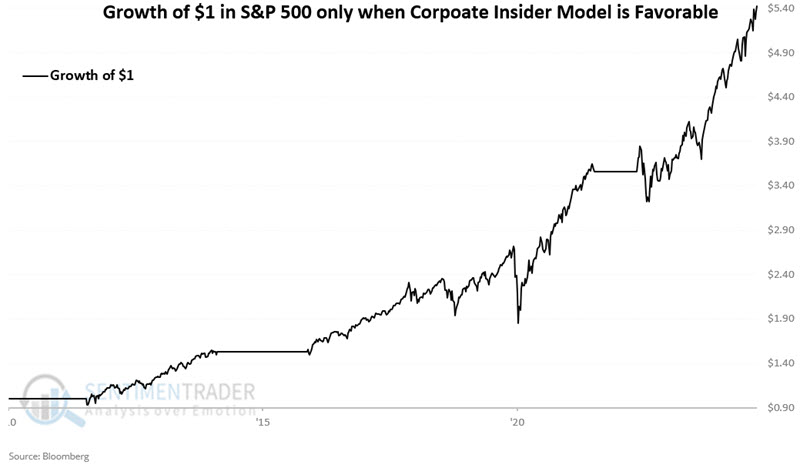
The chart below displays the hypothetical growth of $1 invested in the S&P 500 only when the model detailed above is "favorable."
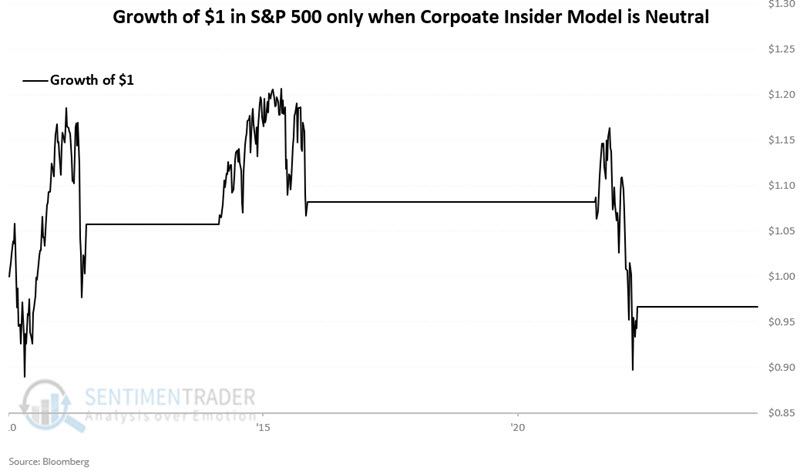
The chart below displays the hypothetical growth of $1 invested in the S&P 500 only when the model detailed above is "neutral."
What the research tells us…
It bears repeating that corporate insider activity is best used not as a standalone trading "system"-triggering "All In" or "All Out" signals-but as a "weight of the evidence" tool. Likewise, it is essential to reiterate that investors should not interpret the latest signal as bearish for stocks. It simply implies that according to this interpretation, corporate insider activity is neither bullish nor bearish for stocks. However, one important pillar of a bull market is no longer in place.