
One Approach to Favoring Value or Growth

Key points:
- There is an ebb and a flow to the relationship between all market factors
- This note will highlight one approach to playing the growth factor versus the value factor
- Long-term results are compelling, but do not come without certain financial and psychological risks
There is an ebb and a flow to market factors
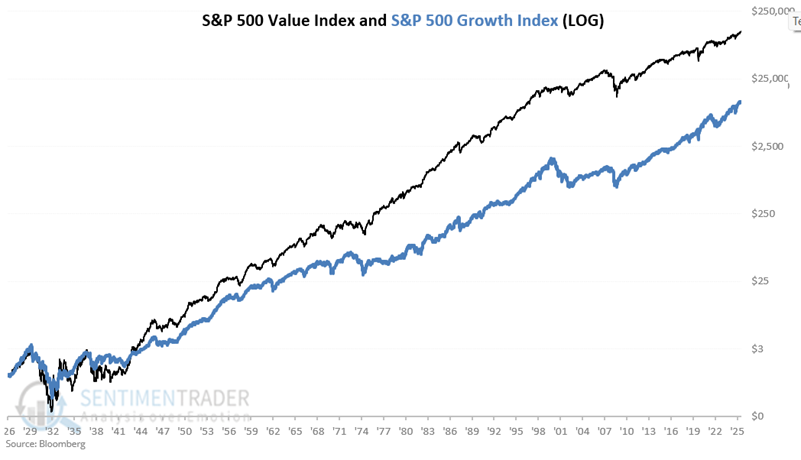
Our test here will examine the relationship between the S&P 500 Value Index and the S&P 500 Growth Index. For our test, we will use weekly data from July 1926, covering almost 100 years of data. Our test runs through January 30th, 2026.
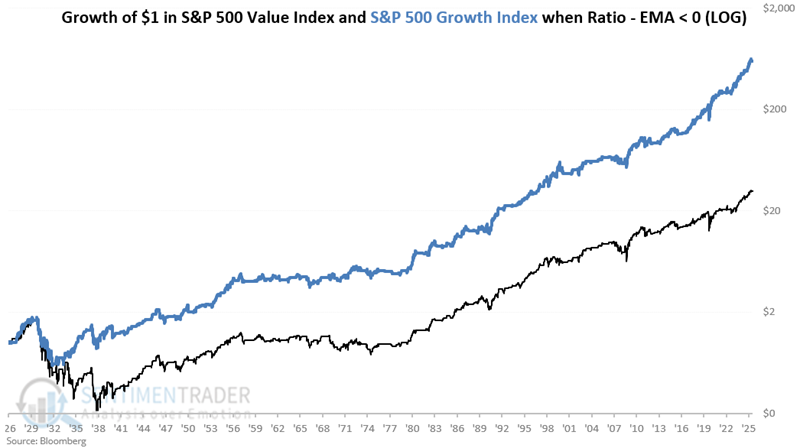
The first chart shows the growth of both indexes - Value in black and Growth in Blue.
To better visualize the ebb and flow between the two indexes, the black line in the following chart divides the S&P 500 Value Index by the S&P 500 Growth Index each week. The blue line represents the 14-week exponential moving average.
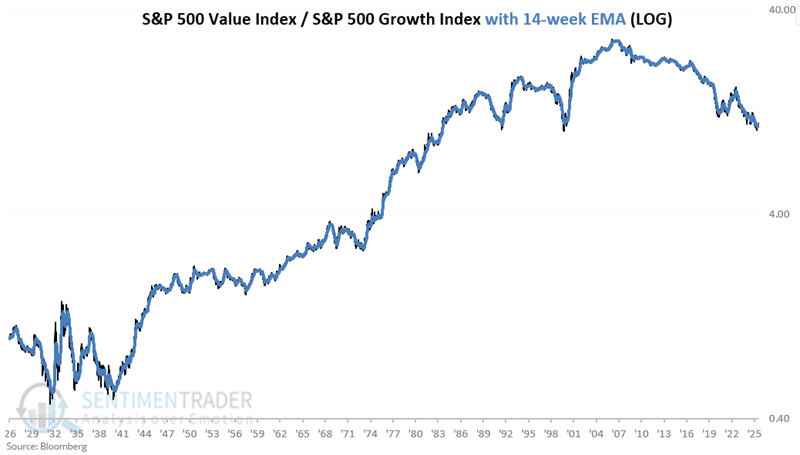
We see in the chart above that the relationship was highly volatile into the late 1930s. After that, the Value Index generally led for the better part of 70 years, with some significant countertrend swings all the way. The Value-to-Growth Ratio (VGR) finally topped out at 28.6 in August 2006 and has been trending steadily lower ever since.
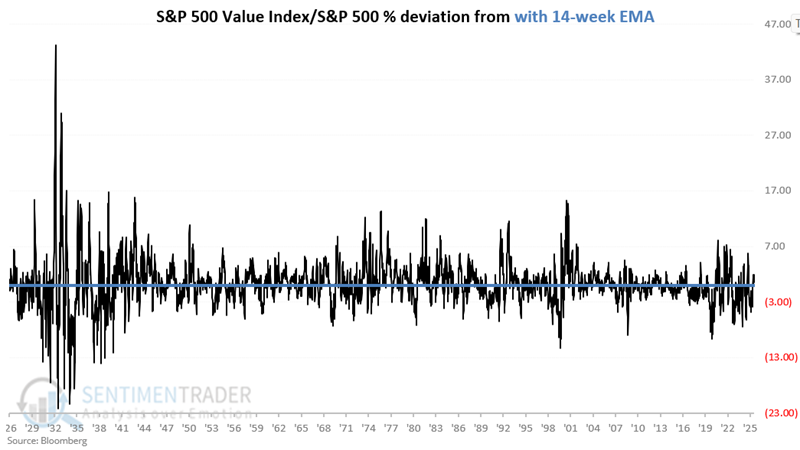
The chart below subtracts the VGR 14-week exponential average from the VGR (i.e., it subtracts the blue line from the black line in the chart above). Readings above zero indicate that the Value index is outperforming the Growth index and vice versa.
Using the 14-week EMA as a trading signal
First, let's examine the performance of the Value and Growth indexes only when the Value/Growth Ratio (VGR) closed the previous week above its 14-week exponential average (EMA).
The chart below shows the hypothetical growth of $1 invested in the Value index (black line) versus $1 in the Growth index only when the VGR closed the previous week above the 14-week EMA. $1 in Value grew to $4,035, $1 in Growth grew to $19.
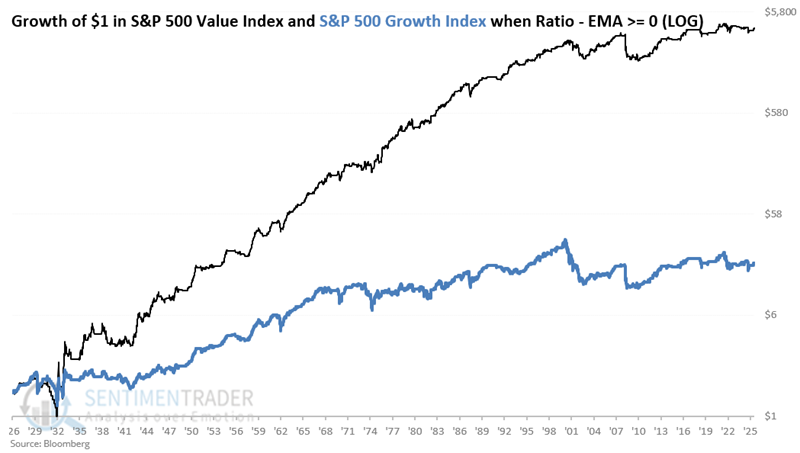
Next, let's examine the performance of the Value and Growth indexes only when the Value/Growth Ratio (VGR) is below its 14-week exponential average (EMA).
The chart below shows the hypothetical growth of $1 invested in the Value index (black line) versus $1 in the Growth index only when the VGR is below the 14-week EMA. $1 in Value grew to $31, $1 in Growth grew to $596.
 The crux of the information conveyed in the charts above is that Value has significantly outperformed Growth when the VGR was above the EMA and vice versa. This lends itself to a potentially systematic approach.
Applying a simple switching strategy
Next, let's compare two potential strategies. We will call the first one the "Switching Strategy," which uses the following rules:
- Buy and hold the S&P 500 Value Index when the Value/Growth Ratio is above its 14-week EMA
- Buy and hold the S&P 500 Growth Index when the Value/Growth Ratio is below its 14-week EMA
We will call the second one the "Split/Rebalance Strategy" (heretofore referred to simply as "Split Strategy", which uses the following rules:
- Put 50% in the S&P 500 Value Index and 50% in the S&P 500 Growth Index
- At the end of the first week of every year, rebalance holdings to a 50/50 split
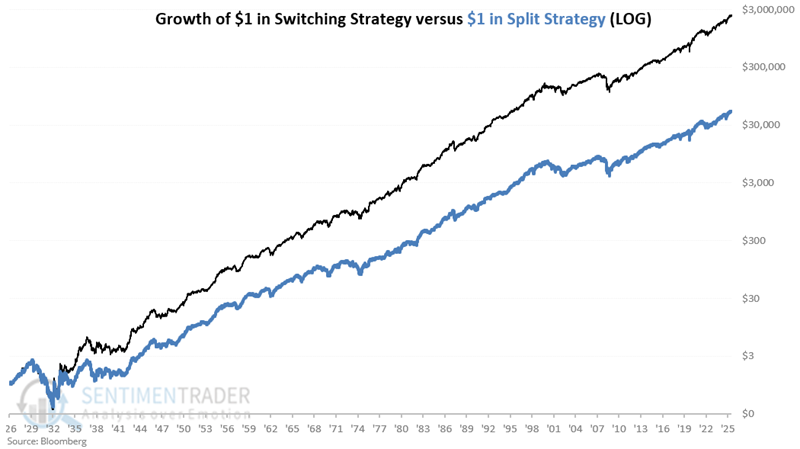
The chart below shows the hypothetical growth of $1 invested since 1926 using the Switching Strategy (black line) versus the Split Strategy (blue line):
- $1 invested using the Switching Strategy grew to $2,408,139
- $1 invested using the Split Strategy grew to $52,734
 Clearly (again, using hypothetical numbers), switching between Value and Growth based on the trend of the relationship outperformed a buy-and-hold (or more accurately, buy, hold, and rebalance once a year) approach. But one important consideration is the consistency of performance. To address this question, each week the chart below divides the hypothetical growth of $1 using the Switching Strategy by the hypothetical growth of $1 using the Split Strategy.
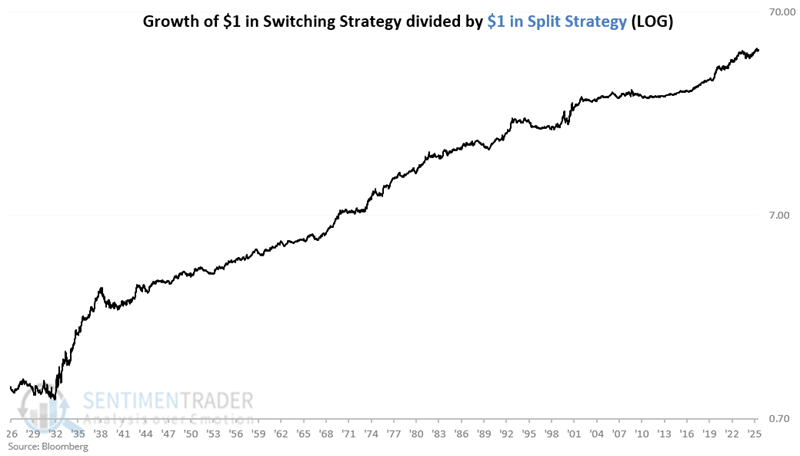
To date, the Switching Strategy has outperformed the Split Strategy by a factor of 46-to-1. While this number and the trend in the chart above are compelling, it is nevertheless critical to understand and appreciate the differences between back testing and real-world trading.
A closer look at the good news
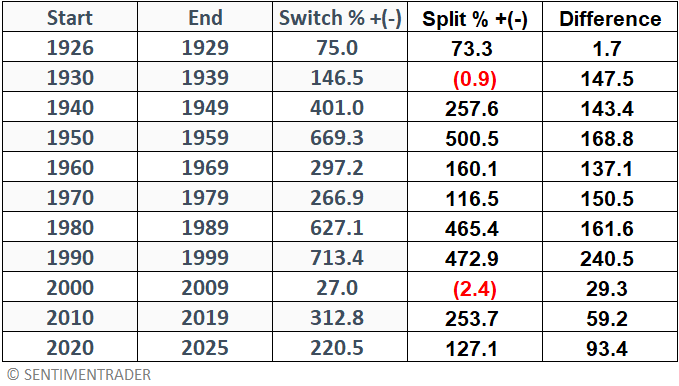
Let's go "Big Picture" and examine the hypothetical results decade by decade. The table below displays hypothetical results for both the Switching Strategy and Split Strategy for each decade, along with the difference between the two. Note that the first period runs from July 1926 through the end of 1929. The last period runs from 2020 through the end of January 2026
Now let's look at all rolling 10-year periods. Our first 10-year period examines results from June 1926 to June 1936. From there, each week we look back at performance over the previous 520 weeks (10 years x 52 weeks). The summary of comparative results appears in the table below. In all, this encompasses 4,675 weeks.
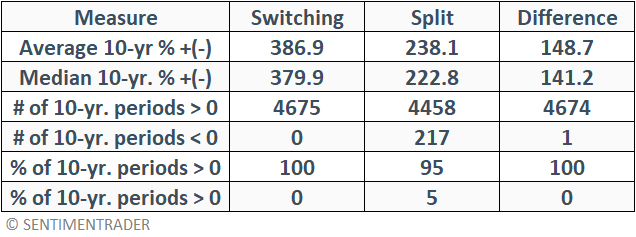
The key point is that the Switching Strategy showed a net gain across all 4,675 ten-year periods examined and outperformed the Split Strategy in each of them. This suggests good reliability. Yet, important risks remain to be examined.
A closer look at the bad news
The Switching Strategy highlighted above is a viable candidate for use in real-world investment. In fact, an investor wishing to do so could use the State Street SPDR Portfolio S&P 500 Value ETF (ticker: SPYV) and the State Street SPDR Portfolio S&P 500 Growth ETF (ticker: SPYG) to emulate the strategy.
A 99+ year history of consistent outperformance is compelling. But it is always Important to "look under the hood" of any investment or trading approach and identify its weaknesses and potential pitfalls, to assess one's own ability to stick with a given strategy long enough to obtain the anticipated benefit.
The most obvious caveat is that just because the results of this near-century test look good, there is absolutely no guarantee that this outperformance will continue into the future. Perhaps an even more compelling concern for anyone considering this approach is: "How likely are you to stick with it?"
Discipline is required to follow any strategy over any period of time. The urge to second-guess one's investment approach is a powerful temptation, particularly when a strategy is not performing as well as hoped.
Take a look at the last chart above, which compares the growth of $1 using the Switching Strategy to the growth of $1 using Split/Rebalance. At a glance, it looks like a pretty solid "Lower left to upper right" experience. But if we take a closer look, we can note several extended periods when the ratio is not making new all-time highs. This means that the Switching Strategy is underperforming buy-and-hold. For how long? The table below lists all periods during which the Switching Strategy underperformed the Split Strategy for at least 52 weeks.
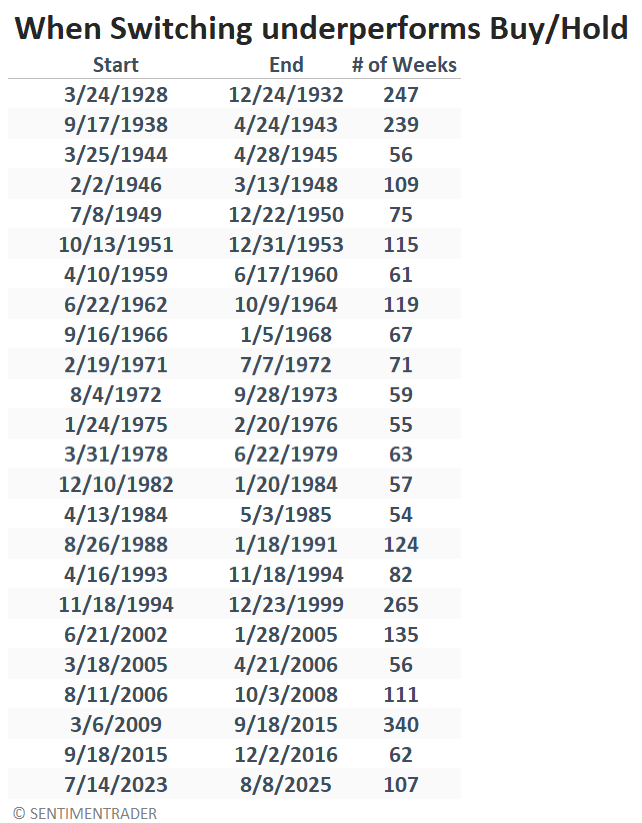
To put it in perspective, let's consider the longest example. From March 2009 through September 2015 (i.e., for 6.5 years), the Switching Strategy underperformed the Split Strategy. During that 340-week period, the Switching Strategy switched between Growth and Value, or Value and Growth, 54 times. So, the rhetorical question is, "Would you keep faithfully making the trades for 6.5 years even if you were underperforming buy-and-hold?"
This conundrum helps explain why sticking to a strategy - and beating the market - is often difficult.
Now for the really bad news. Remember that, as presented here, the Switching Strategy is always 100% fully invested in either a Growth index or a Value index. So, any severe bear market is going to hit hard. To wit:
- Between July 6, 1929, and May 28, 1932, the Switching Strategy experienced a staggering -86.1% drawdown, versus -84.8% for the Split Strategy
- Between 2000 and 2003, the Switching Strategy experienced a -36.8% drawdown, versus -45.5% for the Split Strategy
- Between 2007 and 2009, the Switching Strategy experienced a -52.2% drawdown, versus -55.1% for the Split Strategy
- On seven separate occasions, the Switching Strategy has experienced a drawdown of 30% or more.
The bottom line: Do not confuse the Switching Strategy with "low risk" investing.
Where we are
The chart below shows the S&P 500 Value-to-Growth Ratio (VGR) and its 14-week exponential moving average. The VGR has been above its 14-week EMA (thus favoring Value) since November 21st
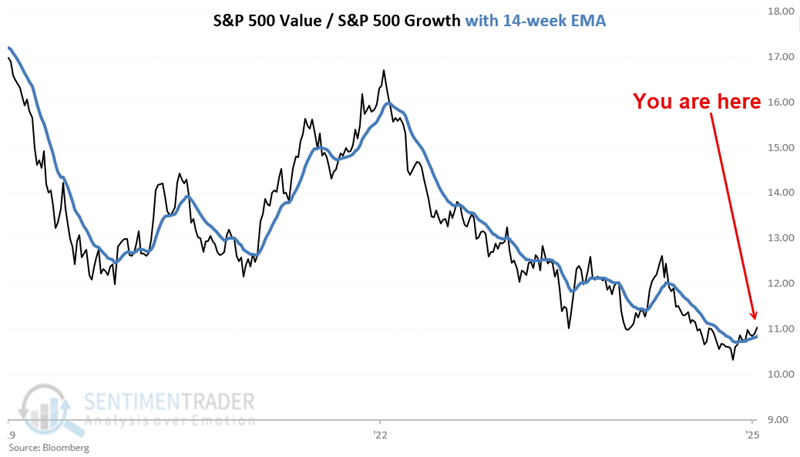
How long this latest trend favoring Value may last is anyone's guess.
What the research tells us…
Let's sum things up with the two following thoughts:
Jay's Trading Maxim #40a: No style, sector, or index EVER holds a permanent advantage.
Jay's Trading Maxim #42: The "hard work" in investing often involves a) fighting the urge to "do something" when you should be doing nothing, OR b) acting decisively when you really don't want to.
Investors who recognize these market truisms and who are willing to be flexible - and to maintain the discipline to act when action is called for, and to sit on their hands the rest of the time - create the opportunity to accumulate significant wealth, and to outperform the market and most other investors in the process. Switching between value and growth factors following the rudimentary model shown above does not guarantee any of these outcomes, but history suggests favorable odds. But remember, strategy is only one part of the equation. Regardless of what strategy - or strategies - you choose to implement, your willingness to objectively implement said strategy is what will ultimately determine your level of success.