
Once more to the Buy the Dip well

Key points
- There are some signs of churning in the market, and history suggests that 2025 will not be the cakewalk that 2023 and 2024 have mostly been
- Still, "Buy the Dip" remains an operative phrase for traders as long as the overall trend remains favorable
- A recent oversold conditioning broad market breadth flashed a favorable sign for stock traders
An oversold indicator flashes green
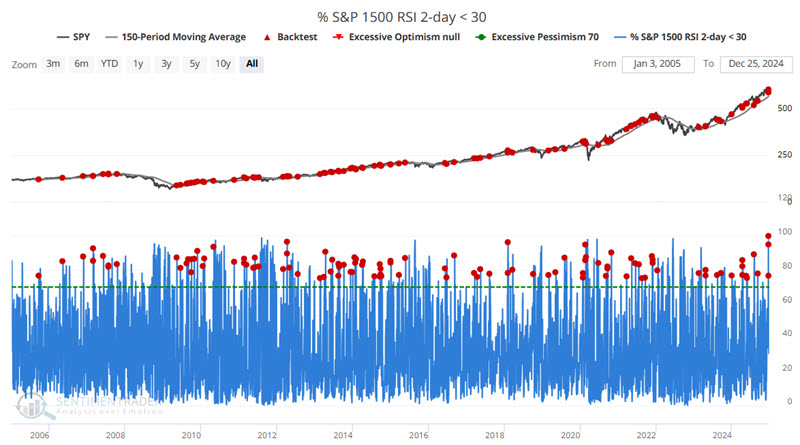
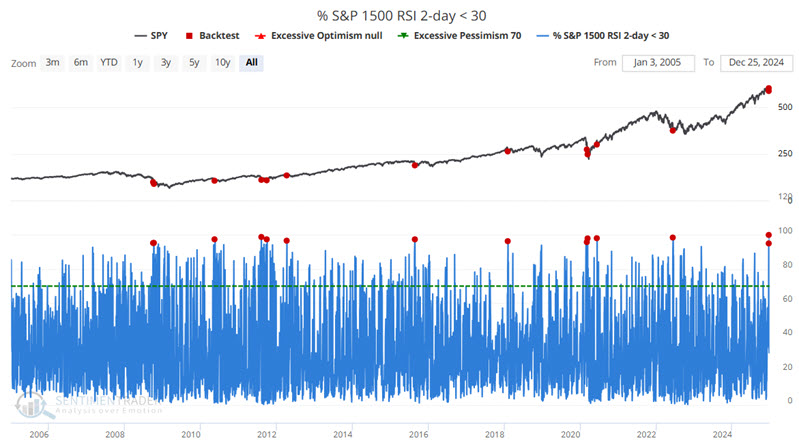
The % S&P 1500 RSI 2-day < 30 is calculated by determining the 2-day RSI values for each of the S&P 1500 symbols and then determining the percentage of those that are at extreme values.
The chart below highlights with a red dot each day when the % S&P 1500 RSI 2-day < 30 indicator was above 75 while SPY was above its 150-day. To spell it out, this highlights dates when the vast majority of stocks (75% or more) are "oversold" (2-day RSI below 30%) while the overall market was still in an established uptrend (i.e., SPY > 150-day moving average). The most recent signal occurred on 2024-12-24.
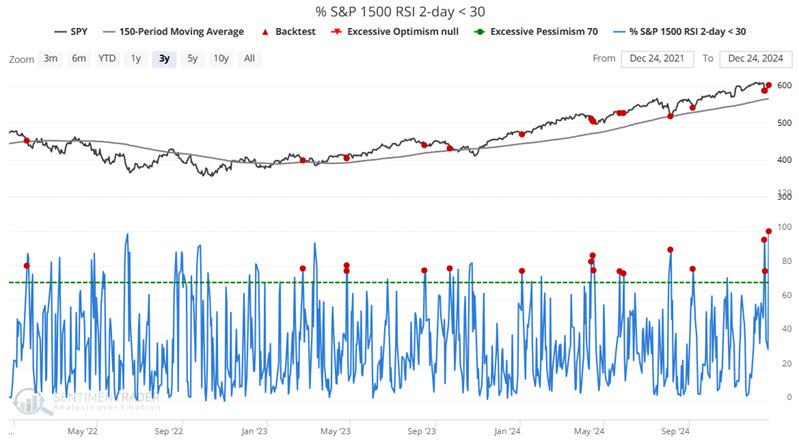
Not every signal qualifies as "precision market timing." Still, the point is that the majority of signals highlight a buying opportunity within a bull market - typically a good time to put idle cash to work. The chart below zooms in on the last three years.
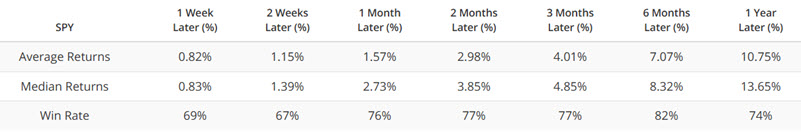
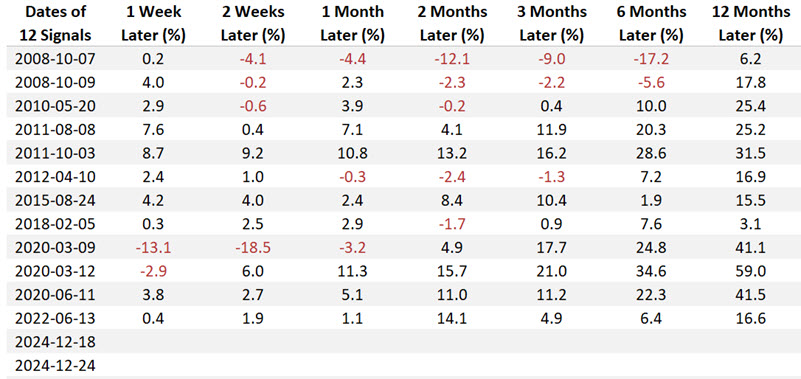
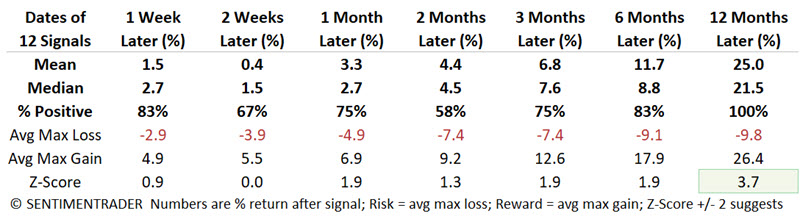
The table below summarizes the subsequent SPY performance.
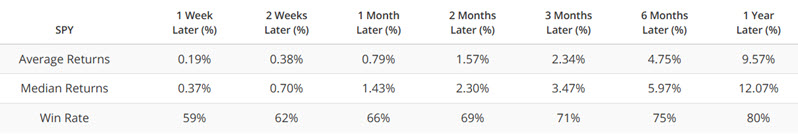
For comparison sake, the table below summarizes SPY performance for all trading days over the same period.
A different take on the same indicator
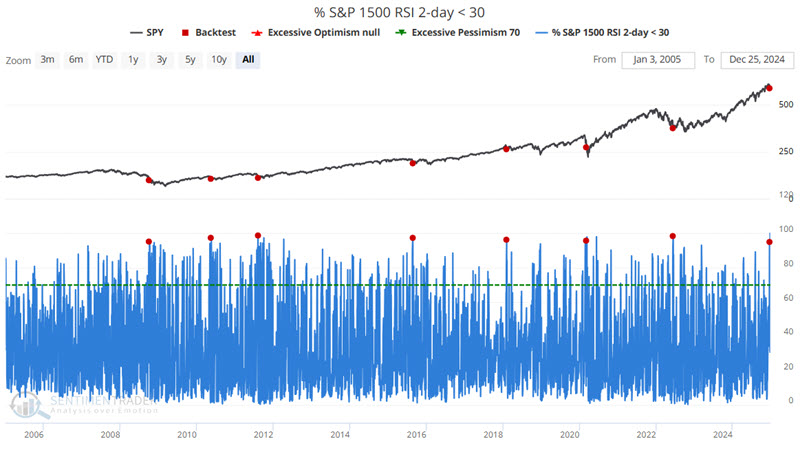
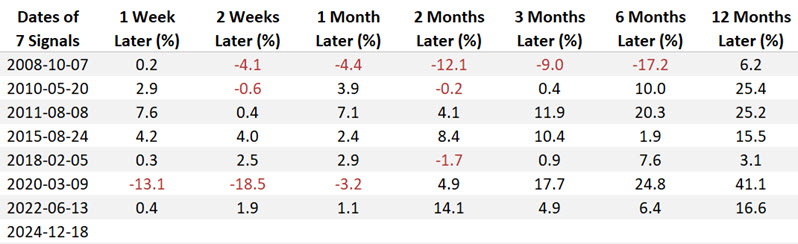
The chart below highlights with a red dot all of those relatively rare days when the % S&P 1500 RSI 2-day < 30 indicator crossed above 95% (i.e., 95% or more of S&P 1500 stocks have a 2-day RSI below 30% or more on the same day). The most recent signals occurred on 2024-12-18 and again on 2024-12-24.
The table below displays subsequent SPY performance on a signal-by-signal basis.
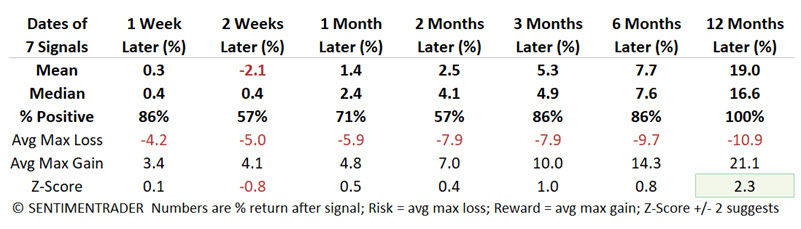
The table below summarizes subsequent SPY performance.
In the test below, we take out duplicate signals by only considering signals that occur one year or more after the previous signal.
The table below displays subsequent SPY performance on a signal-by-signal basis.
The table below summarizes subsequent SPY performance.
What the research tells us…
The signals highlighted above suggest a reasonable probability that the stock market will work its way higher over the year ahead and that the recent decline marks a decent buying opportunity. That said, it is also important to note that they do not signal "All Clear" or smooth sailing ahead, nor will 2025 necessarily resemble 2023 and 2024. They primarily remind longer-term investors to "stay the course" as long as the overall trend remains positive and for shorter-term traders to continue to take advantage of short-term opportunities.