
Once more into the bond abyss

Key Points
- The trend-following method I use suggests we are in the early stages of a long-term rise in interest rates
- Given this potential new trend in rates, the relatively low yield available, and current high inflation, long-term investors may be wise to avoid holding long-term treasuries
- On the other hand, bond traders should be looking for opportunities to play the long side, given a variety of seasonal and technical factors.
Interest rate trend-following
The chart below (courtesy of AIQsystems) displays ticker TYX (yield on 30-yr. treasury bonds). As you can see, it just flipped back to showing a rising rate trend for the first time since 1985.
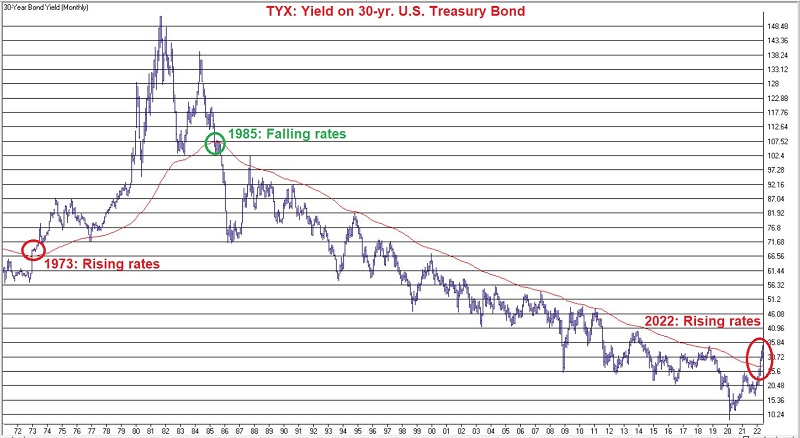
With any trend-following method, there is always the potential for a whipsaw. However, unless and until that happens, the chart above warns longer-term investors to avoid buying long-maturity bonds since that involves locking in the current available rate for many years. Holding shorter-term bonds and rolling into new bonds at a higher rate when the shorter-term bond matures makes sense in a rising rate environment.
Despite this, several factors suggest the potential for a rally in bond prices (even long-term bonds) in the near term.
Seasonality
Treasury bonds are still within the most favorable time of the year - as shown in the chart below.
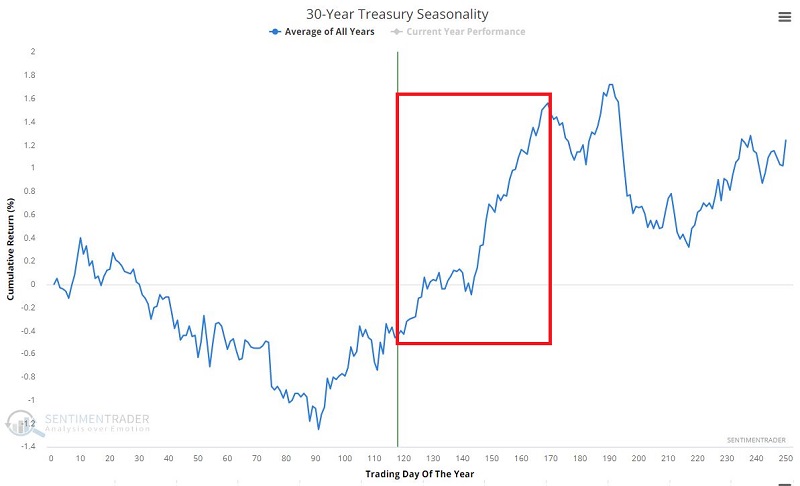
As always, seasonality is "climate, not weather," and each year is its own roll of the dice, and any year can witness a decline instead of an advance. That said, if bonds are going to stage a rebound rally, common sense dictates that that would happen during this seasonally favorable period.
To illustrate just how dreadful of a year it's been for bonds, the chart below displays the same blue line as above, along with the actual performance for 30-year bonds (brown line).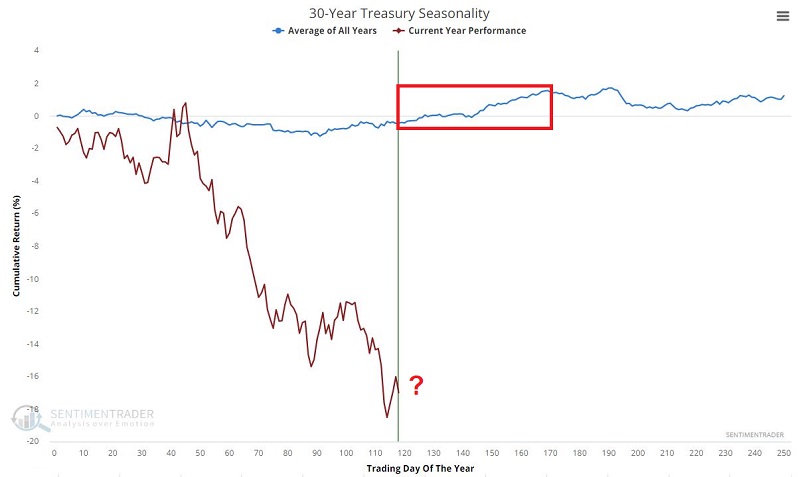
The chart above certainly does not inspire great confidence. Nevertheless, the point remains the same - IF bonds are going to stage a rally, the next several months seem like the most likely time.
TLT Open Interest Ratio
This data series calculates the number of outstanding put options divided by the number of outstanding call options on ticker TLT (iShares 20+ Year Treasury Bond ETF). When traders have been holding many more puts relative to calls in TLT, they have tended to struggle going forward. When there were few puts relative to calls, TLT tended to rise. The chart below displays those times when the reading for this indicator was below 0.50. 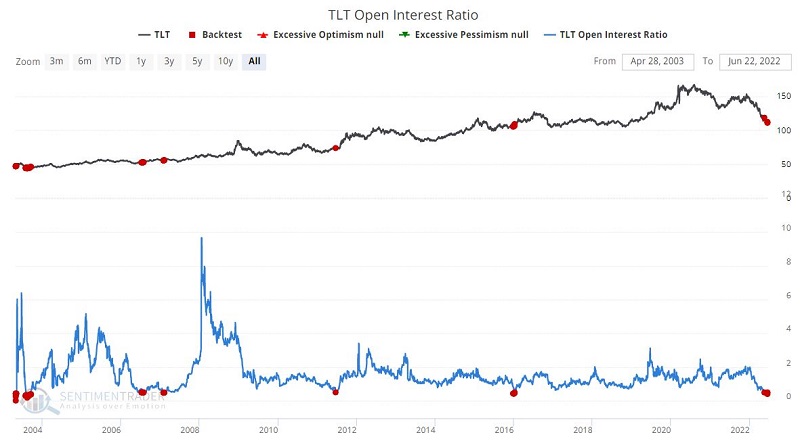
The table below displays a performance summary for TLT following readings below 0.50.
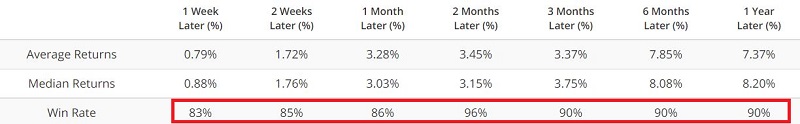
It is important to note that all readings before 2022 occurred within the context of a declining trend in interest rates, so it is reasonable to question the likelihood that the latest signal will play out as well as in previous instances.
Still - like seasonality - it offers shorter-term bond trading bulls a potential reason to look for a buying opportunity.
Playing the bullish side with options
As always, I would point out that the trade below is not a "recommendation." It is an example of one way to play for a trader who:
- Believes that bonds are due for a strong reflex rally
- Does not want to risk a lot of money on that opinion
This strategy is referred to as a "bull call spread" and involves:
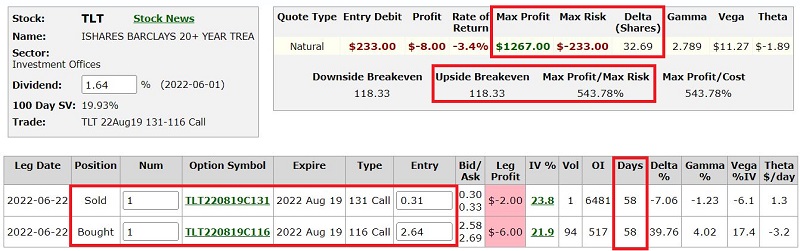
- Buying the Aug19 2022 116 call @ $2.64
- Selling the Aug19 2022 131 call @ $0.31
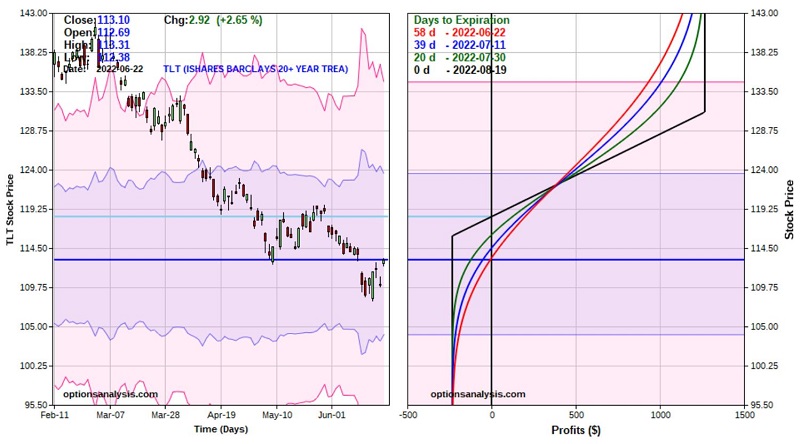
All charts below are courtesy of Optionsanalysis.
The figure below displays the trade particulars, and the chart displays the "risk curves," i.e., expected option trade profit or loss based on TLT price as of a given date leading up to option expiration (black line).
Things to note:
- The cost to enter the trade (and the maximum $ risk) is $233 for a 1-lot
- The maximum profit potential is $1,267 (if the trade is held until expiration and TLT is above $131 a share at that time)
- The current price of TLT shares is $113.10
- The breakeven price (if held until expiration) is $118.33
In terms of managing risk, if TLT declines in price, a trader may:
- Hold until expiration and risk the entire $233
- Exit the trade (for example) if the recent low of $108.11 is taken out
In terms of managing a profit, there are no "rules," only "possibilities":
- If TLT hits $131, it can make sense to close the trade to avoid possible option assignment on the short 131 strike price call
- If TLT were to rally quickly to the $120 range, a trader might consider taking a profit that would likely be close to 100% of the cost of the trade
- If a preferred overbought/oversold type indicator reaches "overbought" territory, it might make sense to take a profit to avoid giving it all back if TLT reverses lower
Bottom-picking in securities that have suffered massive declines is an exercise fraught with peril and is not recommended as a "Go-To" strategy. That said, speculation involves taking risks. For a trader who truly suspects that bonds are due for a bounce, a low dollar risk option trade offers the opportunity to play that opinion while still keeping dollar risk low. Consider the following:
With TLT at $113.10 a share, a trader would need to put up $11,310 to buy 100 shares (and create a position with a delta of 100, one delta per share of stock held long). On the other hand:
- An options trader could enter the position highlighted above as a 3-lot
- Since a 1-lot has a delta of 32.69, a 3-lot would have a delta of 98.08
- This means that the option position would behave almost exactly like a long 100 shares of TLT position - at the cost of $699 ($233 x 3-lot) instead of $11,310
Remember: If TLT does not rally before August expiration, the options will expire worthless - resulting in a 100% loss of $233 for a 1-lot (or $699 for a 3-lot).
What the research tells us…
Seasonality and TLT Open Interest suggest a "possibility" (and not necessarily a high "probability") that bonds may finally bounce in the months ahead. Betting on the long side of treasury bonds is a "big-time speculative idea." When entering a play like this, a trader must be mentally prepared to take a loss and ensure that the expected dollar risk is within their own tolerance level for risk.