
Once again Titanic

Key points:
- The Titanic Syndrome fired after an extended dormancy, one of only 24 long-gap triggers in decades of data
- Short-term outcomes are noisy, but patience is rewarded: 1-year win rates top 74% for defensive sectors
- Sector splits are stark, defensive sectors win on certainty, cyclical sectors win on returns
- Health Care breaks the mold with both high win rates and high returns
- Energy is the clear avoid: 56% win rate at one year, the only sector below 60%
The NASDAQ has been hovering near record highs, yet underneath the surface, breadth has been crumbling. That combination, the index up while most of its components are not, is exactly what the Titanic Syndrome captures. And it just triggered again after a long silence.
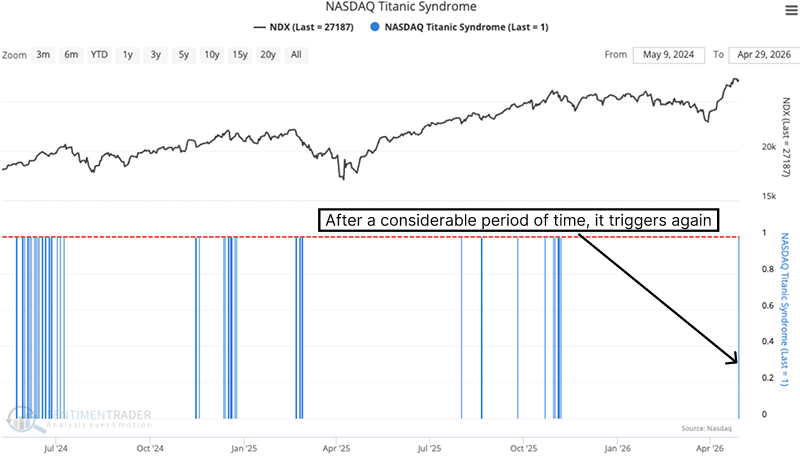
Some signals fire so often they become background noise. This one went quiet. The gap between triggers itself became part of the signal. The Titanic Syndrome fires on the NASDAQ. S&P sector show how that breadth collapse ripples beyond tech, and the split matters for positioning regardless of which index triggered the signal.Filtering for only those instances where the Titanic Syndrome fired after a prolonged dormancy narrows the field to 24 occurrences across decades.
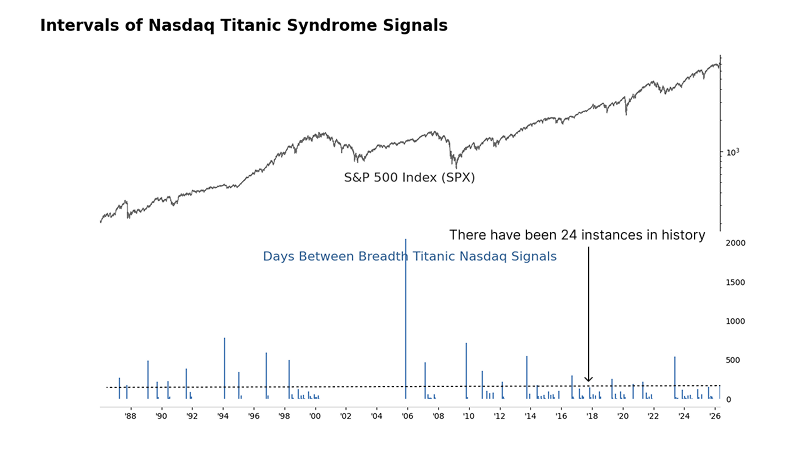
The historical record
Of those 24 triggers, several led to immediate losses. The 1987 episode stands out: the S&P 500 dropped 22% within a month. But that was the exception, not the rule. The median 1-month return across all triggers sits near breakeven. Six months later, the index was higher a solid majority of the time. By the one-year mark, the median gain exceeded 10%.
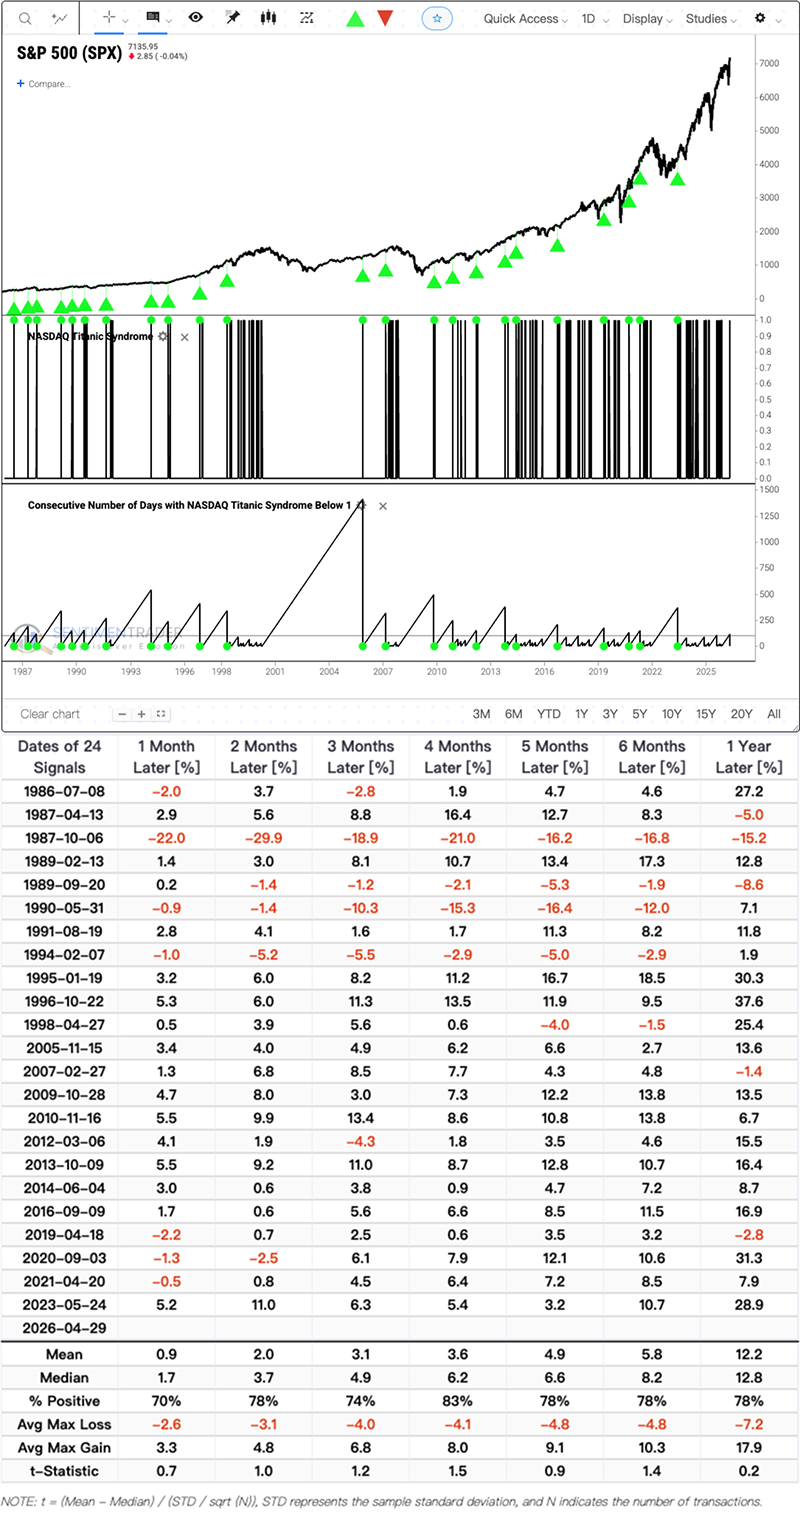
That pattern, rough start and reliable finish, is consistent enough to trust directionally, but the averages mask a deep split between sectors.
Not all recoveries are equal
Defensive sectors deliver the weakest returns. Consumer Staples managed just 10.3% at one year, the lowest among all nine groups. Utilities was the only sector to post a negative median return at the 1-week mark. These are safety plays that barely appreciate after the signal fires.
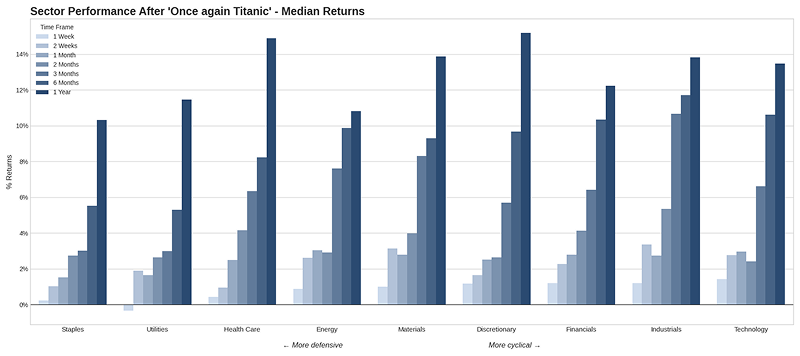
At the other end, Consumer Discretionary topped the board at roughly 15%, followed by Health Care at 14.8% and Industrials at 14%. The cyclical trade dominates the recovery. The kicker is Health Care, which delivered cyclical-level returns while keeping its defensive shield intact. Energy, by contrast, posted just 10.8% at one year, second-worst overall.
The win rate data draws the picture even more sharply. Defensive sectors lock in the highest long-term certainty: Staples, Utilities, and Health Care all reached 74.5% win rates at one year, meaning holders made money in roughly three out of four instances. The catch is the short term. Staples managed only a 43% win rate at one month, less than a coin flip. Utilities dropped to 31% at one week. These are not short-term trades.
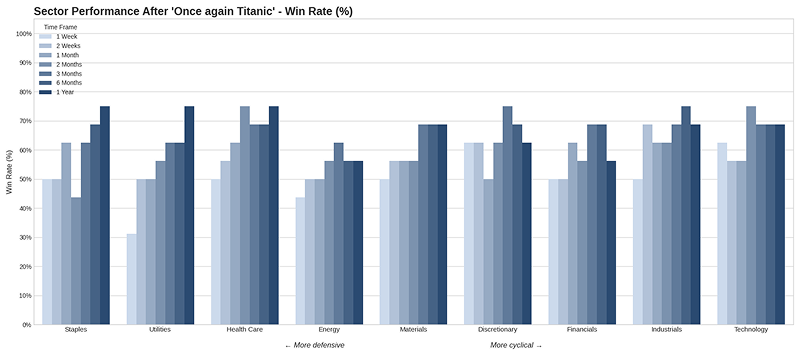
Among cyclical sectors, Discretionary and Technology opened with 62% win rates at the 1-week mark, the highest short-term certainty across the entire group. Industrials matched that at the 1-month horizon. The early recovery favors risk assets, not safety. Energy again failed: its 1-year win rate of 56% was the only one below 60%. Holding Energy after this signal has been a coin flip even over a full year, and a poorly paying one at that.
What the research tells us...
After the Titanic Syndrome fires, short-term trading is a low-probability game across the board. The structural edge belongs to patience, specifically, patient exposure to Industrials, Health Care, and Consumer Discretionary, which combine above-median returns with win rates in the mid-to-upper 60s at one year. A defensive anchor in Health Care or Staples locks in the 74.5% long-term certainty, but the return premium lives on the cyclical side. With only 24 long-gap triggers in the record, the sample is thin. Whether the current backdrop mirrors the average historical window is an open question. Energy has no role here.