Products
SentimenTrader Trading Tools
‍
Backtest Engine
My Trading Toolkit
Correlation Analysis
Seasonality
Indicators & Data API
‍
Proprietary Indicators & Charts
Market Data API
Strategies & Scanner
‍
50+ Trading Strategies
Smart Stock Scanner
Research Reports
‍
Research Solutions
Reports Library
Free Resources
Simple Backtest Calculator
Simple Seasonality Calculator
The Kelly Criterion Calculator
Sentiment Geo Map
Public Research Reports
Pricing
Company
About
In the News
Testimonials
Client Success Stories
Contact
Log inLoginSign up
< BACK TO ALL REPORTS

Oil And Energy Collapse; RSI Divergence; Smart-Dumb Money Extreme; Overwhelming Lows

Jason Goepfert
2018-12-19
null

This is an abridged version of our Daily Report.

No energy

Crude oil collapsed with a large loss and 52-week low on Tuesday. That’s not what the Energy stock sector needed right now but taking the chance that we’re whistling past the graveyard, the losses on Monday and Tuesday may just be bad enough to be good.

Also worth noting is that more than 60% of the stocks hit a 52-week low on Tuesday, the 12th-largest percentage out of nearly 7,300 trading days.

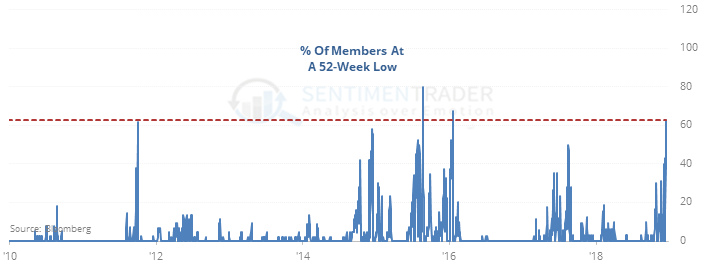
In the face of epic collapses like this, the Energy sector rebounded about 80% of the time over the medium-term.

Not oversold enough (?)

The S&P 500’s Relative Strength Index fell into oversold territory in October but hasn’t since.

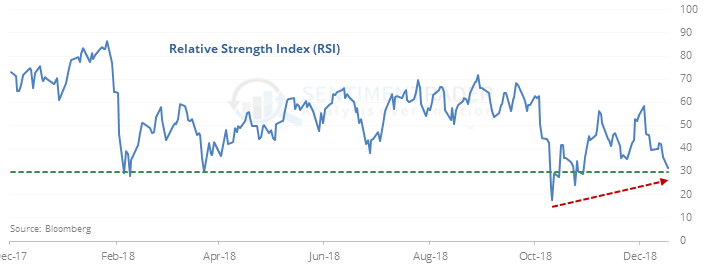
The latest leg lower in stocks has been accompanied by a higher RSI, suggesting that stocks aren’t “oversold enough.” But that doesn’t hold water when looking at other instances, especially since 1950.
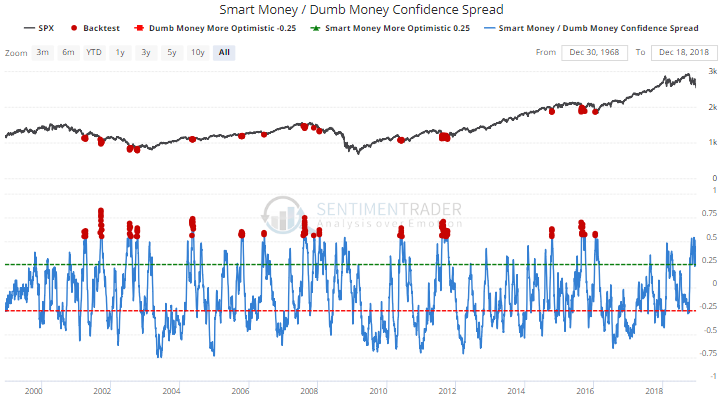
Wide spread

There is now the widest difference between Smart Money and Dumb Money Confidence since January 2016. Using the Backtest Engine, we can see that such wide spreads led to good returns for the S&P 500, even if we’re in a bear market or recessionary market environment.

Click here to see a more detailed blog post about testing this spread during bear markets and recessions.

Overwhelming

During the past 3 sessions, the number of 52-week highs on the NYSE have made up fewer than 1.25% of new highs and new lows. This kind of overwhelming push in new lows has been seen on 41 days in the past 30 years. All 41 showed a higher return in the S&P 500 over the next year, averaging 20.6%. On a medium-term time frame, the only days with meaningful losses were 5 sessions in early October 2008.

PRODUCTS
SentimenTrader
Trading Tools
Indicators & Data API
‍
Strategies & Scanner
‍
Research Reports
FREE
RESOUrCES
Simple Backtest
Calculator
Simple Seasonality
Calculator
The Kelly Criterion
Calculator
Sentiment Geo Map
‍
Public Research Reports
‍
Pricing
Bundle pricing
‍
Announcements
‍
FAQ
COMPANY
‍
About
‍
In the News
‍
Testimonials
‍
Client Success Stories
CONTACT
‍
General Inquiries
‍
Media Inquiries
‍
Financial Professionals Inquiries
‍
© 2025 Sundial Capital Research Inc. All rights reserved.
Setsail Marketing
TermsPrivacyAffiliate Program
Risk Disclosure: Futures and forex trading contains substantial risk and is not for every investor. An investor could potentially lose all or more than the initial investment. Risk capital is money that can be lost without jeopardizing ones’ financial security or life style. Only risk capital should be used for trading and only those with sufficient risk capital should consider trading. Past performance is not necessarily indicative of future results.

Hypothetical Performance Disclosure: Hypothetical performance results have many inherent limitations, some of which are described below. No representation is being made that any account will or is likely to achieve profits or losses similar to those shown; in fact, there are frequently sharp differences between hypothetical performance results and the actual results subsequently achieved by any particular trading program. One of the limitations of hypothetical performance results is that they are generally prepared with the benefit of hindsight. In addition, hypothetical trading does not involve financial risk, and no hypothetical trading record can completely account for the impact of financial risk of actual trading. for example, the ability to withstand losses or to adhere to a particular trading program in spite of trading losses are material points which can also adversely affect actual trading results. There are numerous other factors related to the markets in general or to the implementation of any specific trading program which cannot be fully accounted for in the preparation of hypothetical performance results and all which can adversely affect trading results.

Testimonial Disclosure: Testimonials appearing on this website may not be representative of other clients or customers and is not a guarantee of future performance or success.