
Oh (No) Canada!

Key points
- The Canadian Dollar is entering a period of typically significant seasonal weakness
- Trader sentiment is flashing an oddly contrarian unfavorable signal
- Hedger's positioning is also flashing an unfavorable sign
Canadian Dollar enters the seasonal danger zone
The chart below displays the annual seasonal trend for the Canadian Dollar.
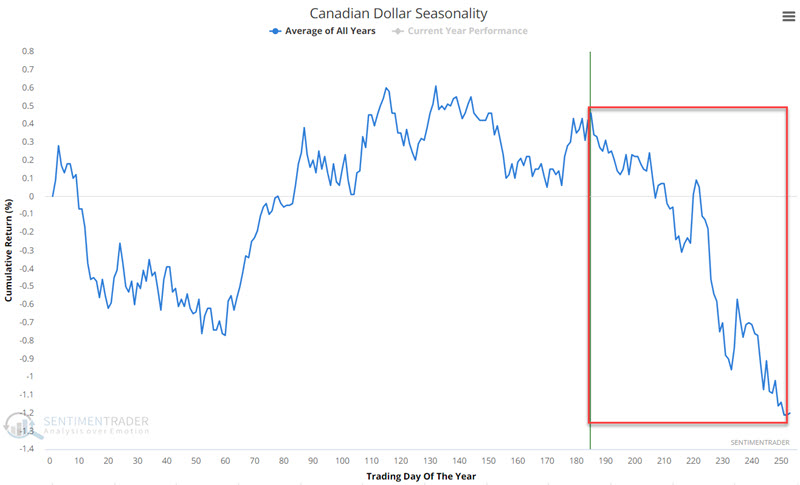
The red box highlights the period that extends from the close on Trading Day of Year #185 through TDY #251. For 2023, this period extends through the close on 2023-12-18.
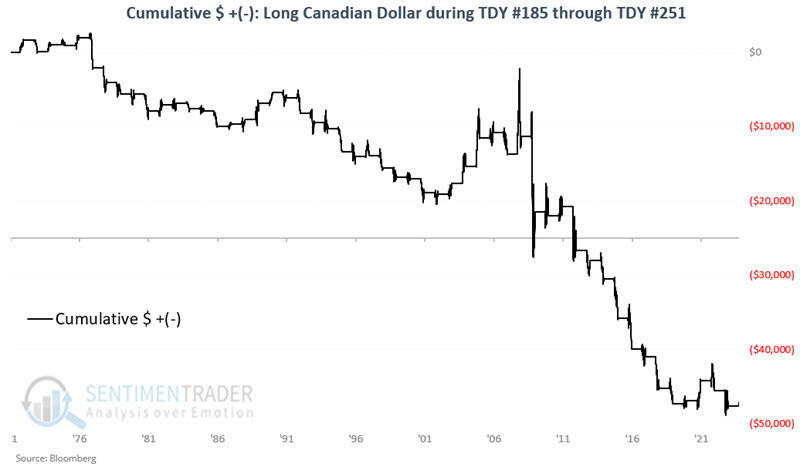
The chart below displays the hypothetical cumulative $ +(-) from holding a long position in Canadian dollar futures only during this unfavorable period every year since 1971.
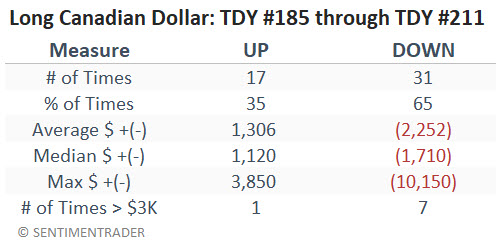
The table below summarizes Canadian dollar futures performance during this unfavorable period.
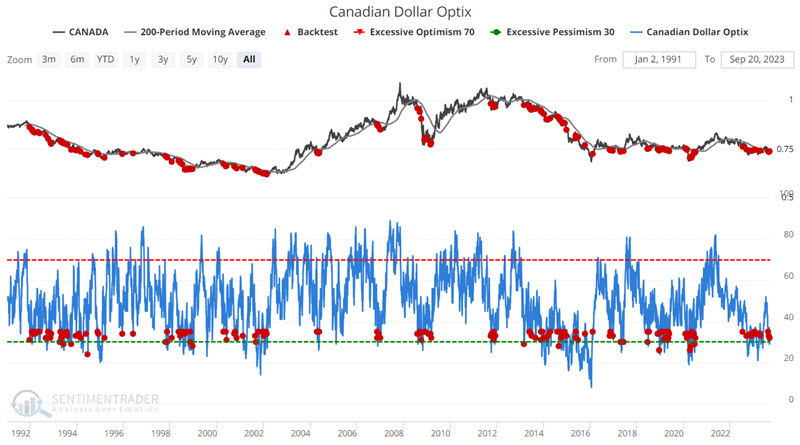
Sentiment is not a favorable factor
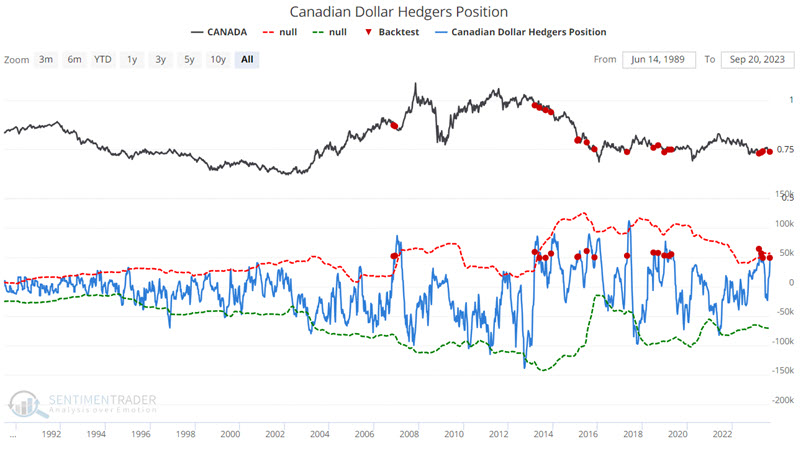
Generally, the lower our Optix indicator falls, the more likely the highlighted market or index will stage a reversal. But there are exceptions to every rule. The Canadian Dollar appears to be one of those exceptions. The chart below displays those times when:
- Canadian Dollar Optix crossed below 35
- While the Canadian Dollar was below its 200-day moving average
- And the 200-day moving average was trending lower
The table below summarizes Canadian Dollar performance following the dates highlighted in the chart above.
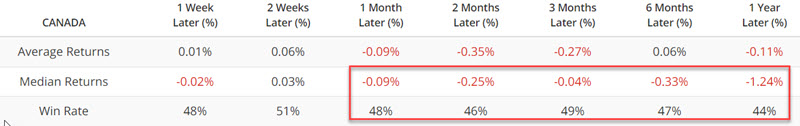
There are a few important things to note. This is by no means an "overwhelmingly bearish" signal. The Win Rates across the board are just under coinflip territory, so this is not a signal that would ever be used as a standalone model. Still, let's take a closer look at the chart of previous signals above. We find a strong tendency to witness repeat signals when the Canadian Dollar experiences a longer-term downtrend.
The recent string of signals in the last year appears to lend some weight to the bearish case.
Hedger's positioning lends more weight to the bearish case
The chart below highlights when the Canadian Dollar Hedgers Position crossed above 49,000.
The table below summarizes Canadian Dollar performance following the dates highlighted in the chart above.
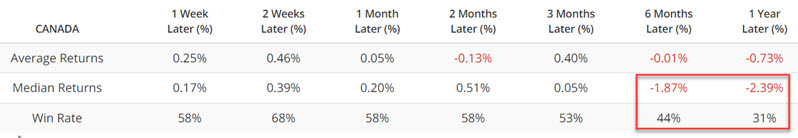
This is another example of an indicator that would not likely be useful as a standalone trading model BUT which can be helpful as part of a larger weight of the evidence approach. The Canadian Dollar has shown some strength in the months directly after a signal, followed by weakness in the months after that.
What the research tells us…
None of the indicators highlighted above qualify as "world-beaters." Nevertheless, when taken together, they do paint a picture. That picture suggests the potential for weakness in the Canadian Dollar between now and mid-December.