Products
SentimenTrader Trading Tools
‍
Backtest Engine
My Trading Toolkit
Correlation Analysis
Seasonality
Market Prediction
Indicators & Data API
‍
Proprietary Indicators & Charts
Market Data API
Strategies & Scanner
‍
50+ Trading Strategies
Smart Stock Scanner
Smart Option Scanner
Research Reports
‍
Research Solutions
Reports Library
Free Resources
Simple Backtest Calculator
Simple Seasonality Calculator
The Kelly Criterion Calculator
Sentiment Geo Map
Public Research Reports
Education
Sentiment Indicators
Technical Indicators
Pricing
Company
About
In the News
Testimonials
Client Success Stories
Contact
Log inLoginSign up
< BACK TO ALL REPORTS

Off the Beaten Path with Homebuilders and the German Stock Market

Jay Kaeppel
2025-11-13
Short-term traders seeking opportunities where few others are looking should consider two unloved sectors: homebuilder stocks and the German stock market. Details herein.

Key points:

  • The stock market has advanced sharply in recent months, so a pullback remains a distinct possibility
  • That said, several sectors are entering periods of historically significant and persistent fourth-quarter strength 
  • Traders should be looking for opportunities to play the long side in homebuilding stocks and the German stock market

Sector #1: Homebuilders (XHB)

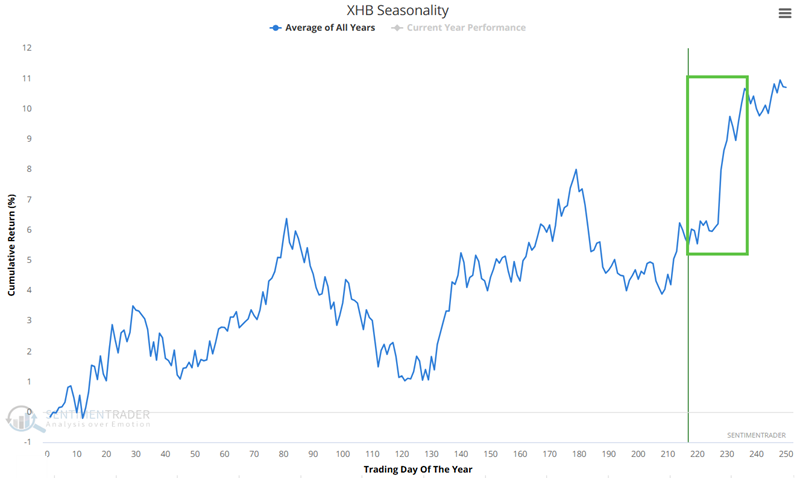
The Annual Seasonal Trend chart for the State Street SPDR S&P Homebuilders ETF (XHB) is entering a favorable period that extends from Trading Day of the Year (TDY) #217 through TDY #236. For 2025, this period extends from November 12th through December 10th.

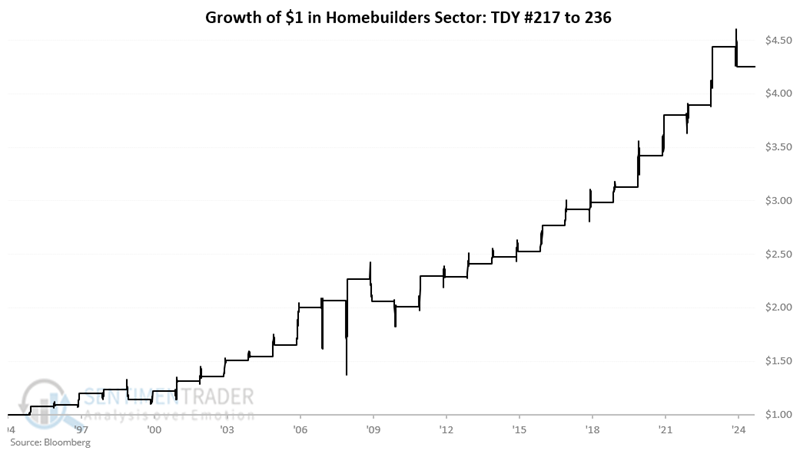
The chart below displays the hypothetical growth of $1 invested in the S&P 1500 Homebuilders Index (which enjoys a roughly 0.99 correlation to XHB) during this period since 1995. A hypothetical $1 invested in this index during this period, every year since 1995, has gained 325%.

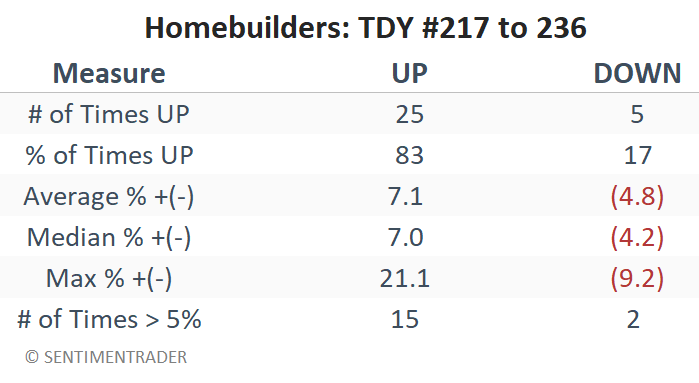
The table below summarizes the performance of the homebuilder sector during this period, from 1995 to the present.

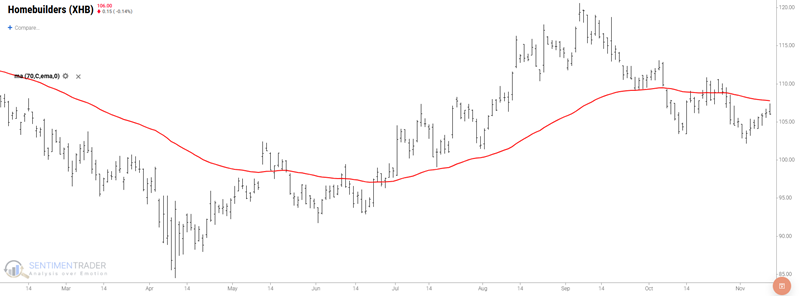
XHB is presently trading below its 70-day exponential average. So technically, seasonality and price are not currently in agreement (which I prefer to see). Aggressive traders could consider a long position with a stop below the recent lows. Others might wait for the price to confirm a favorable trend before jumping in.

Sector #2: The German stock market

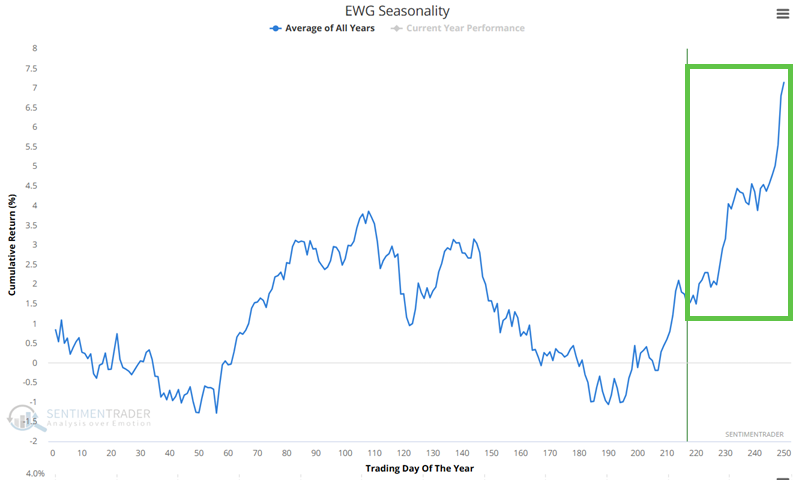
The Annual Seasonal Trend chart for the iShares MSCI Germany ETF (EWG) highlights a period that extends from Trading Day of the Year (TDY) #217 through the end of the year. For 2025, this period extends from November 12th through December 31st.

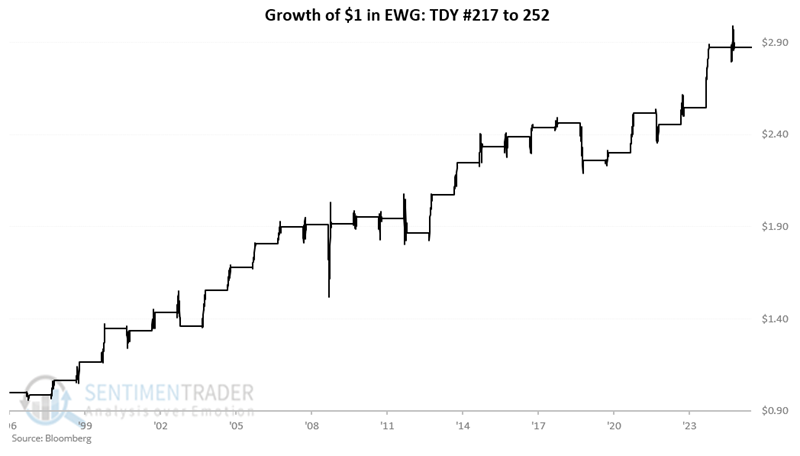
The chart below displays the hypothetical growth of $1 invested in EWG during this period since 1999. A hypothetical $ invested in EWG during this period, every year since 1996, has gained 179%.

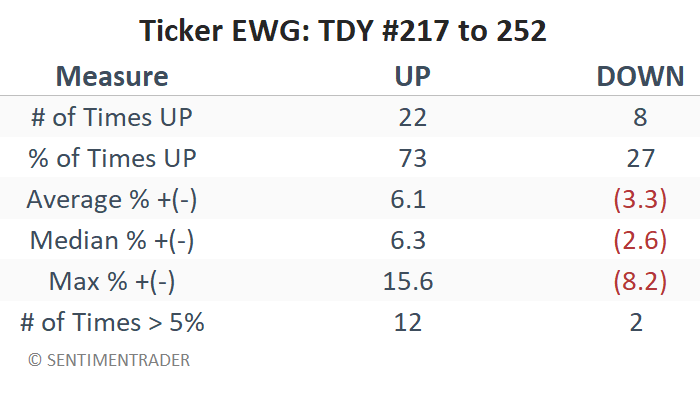
The table below summarizes EWG's performance during this period since 1996.

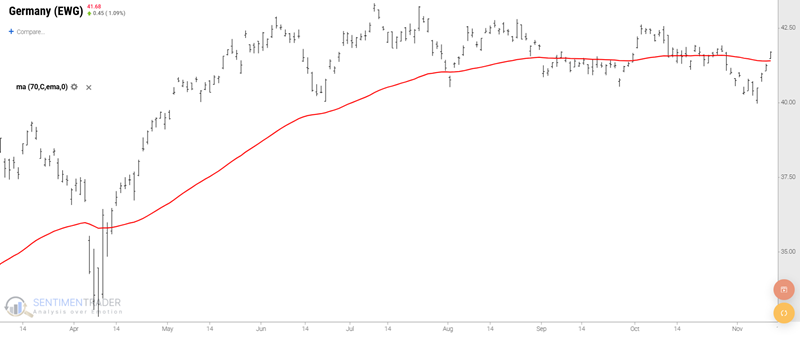
Ticker EWG has traded sideways for the last six months. However, it just ticked back above its 70-day EMA, so seasonality and price trend are presently in agreement.

What the research tells us…

Will homebuilders resume an uptrend? Will the German stock market follow through to the upside after going nowhere for six months? Unfortunately, we do not have a crystal ball and cannot predict the future. That said, we can review history and note that both have a robust history of showing strength during the fourth quarter. Traders looking for an "edge" should look closely for opportunities to play the long side of these sectors as 2025 moves through its final quarter.

PRODUCTS
SentimenTrader
Trading Tools
Indicators & Data API
‍
Strategies & Scanner
‍
Research Reports
FREE
RESOUrCES
Simple Backtest
Calculator
Simple Seasonality
Calculator
The Kelly Criterion
Calculator
Sentiment Geo Map
‍
Public Research Reports
‍
Education
Sentiment Indicators
‍
Technical Indicators
‍
Pricing
Bundle pricing
‍
FAQ
‍
Announcements
‍
COMPANY
‍
About
‍
In the News
‍
Testimonials
‍
Client Success Stories
CONTACT
‍
General Inquiries
‍
Media Inquiries
‍
Financial Professionals Inquiries
‍
© 2026 Sundial Capital Research Inc. All rights reserved.
Setsail Marketing
TermsPrivacyAffiliate Program
Risk Disclosure: The information and tools provided are for research and analytical purposes only and are not intended as investment advice. Market analysis involves uncertainty, and outcomes may differ from expectations. Users should conduct their own due diligence and consider their individual circumstances before making any financial decisions. Past performance is not necessarily indicative of future results.

Hypothetical Performance Disclosure: Hypothetical performance results have many inherent limitations, some of which are described below. No representation is being made that any account will or is likely to achieve profits or losses similar to those shown; in fact, there are frequently sharp differences between hypothetical performance results and the actual results subsequently achieved by any particular trading program. One of the limitations of hypothetical performance results is that they are generally prepared with the benefit of hindsight. In addition, hypothetical trading does not involve financial risk, and no hypothetical trading record can completely account for the impact of financial risk of actual trading. for example, the ability to withstand losses or to adhere to a particular trading program in spite of trading losses are material points which can also adversely affect actual trading results. There are numerous other factors related to the markets in general or to the implementation of any specific trading program which cannot be fully accounted for in the preparation of hypothetical performance results and all which can adversely affect trading results.

Testimonial Disclosure: Testimonials appearing on this website may not be representative of other clients or customers and is not a guarantee of future performance or success.