
Off the beaten path with DIS

Key Points
- Investor sentiment regarding Disney recently bottomed out and reversed higher
- This action tends to resolve itself with Disney stock moving higher over the next six months
Disney Optix
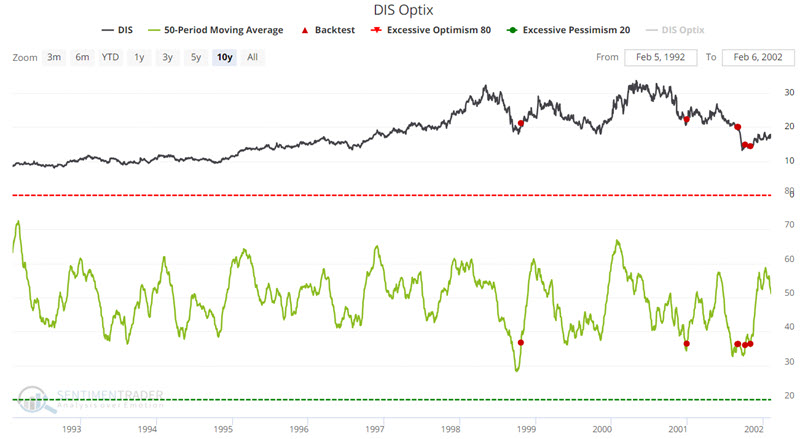
The chart below displays each occasion since 1962 when the 50-day moving average for DIS Optix crossed above 36. You can run this test in the Backtest Engine.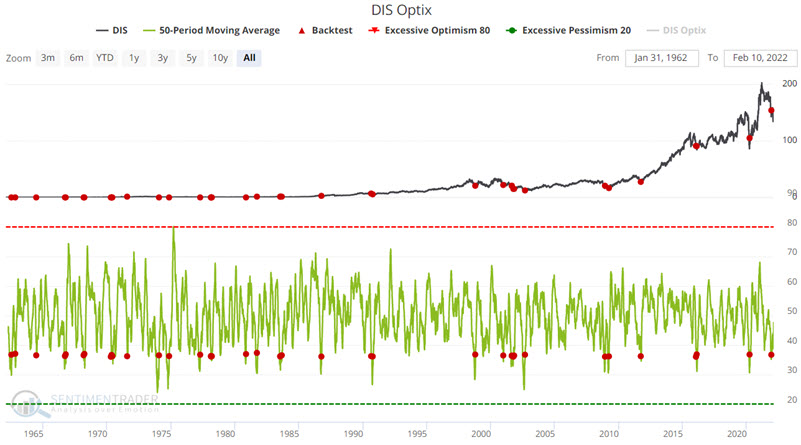
Of course, to cross above 36, the 50-day average first needs to cross below 36. This typically involves some persistently unfavorable price action for DIS, which ultimately causes investor sentiment to turn extremely unfavorable. The cross back above 36 signifies that the overdone negative extreme in sentiment has been completed and that the stock may be set to rally again.
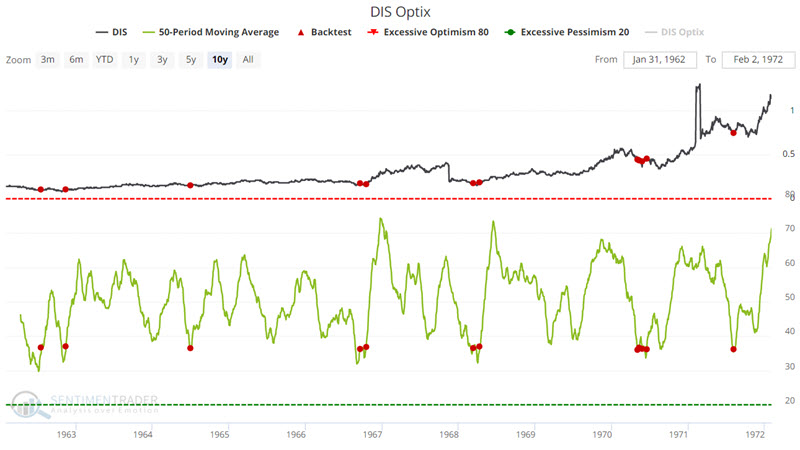
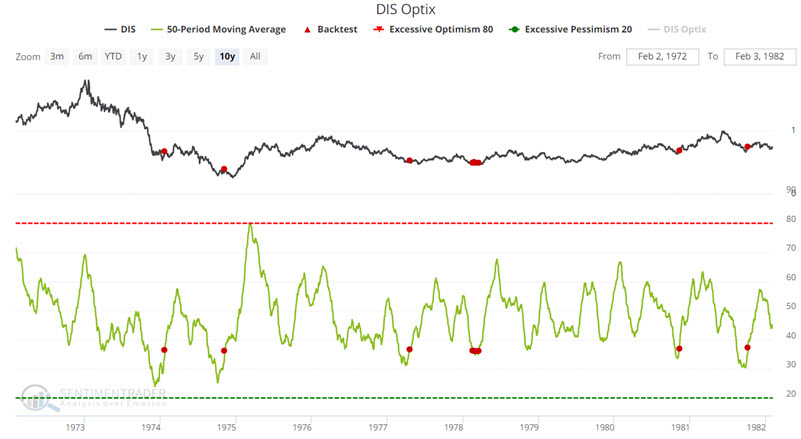
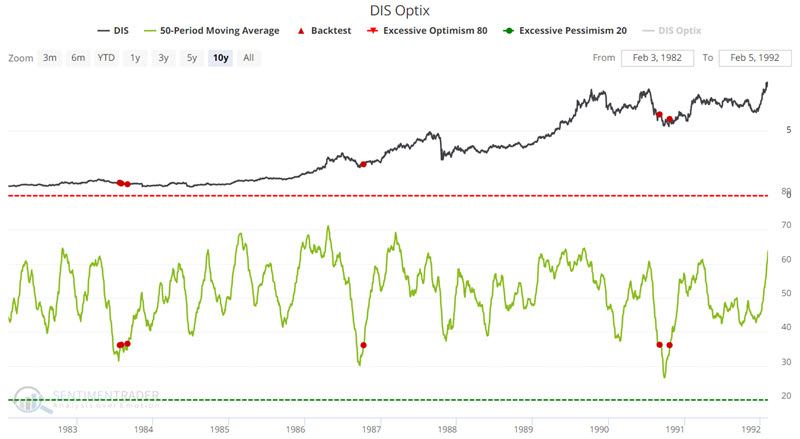
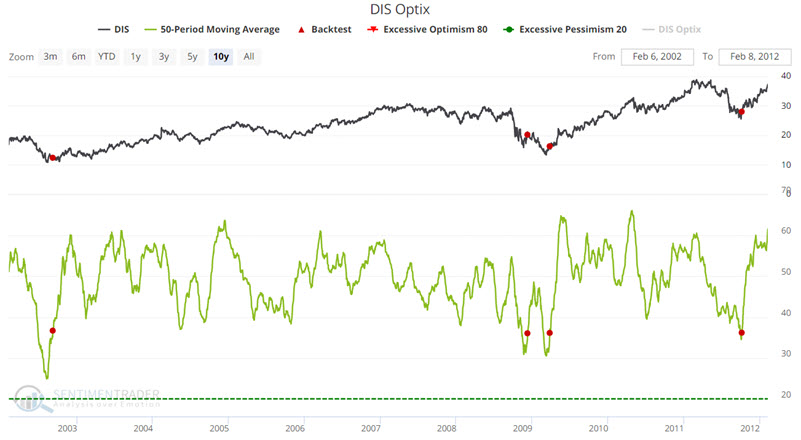
To get a better feel for market action before and after the signals, the charts below break price action into roughly 10-year segments to provide a clearer picture of stock price action before and after each signal.
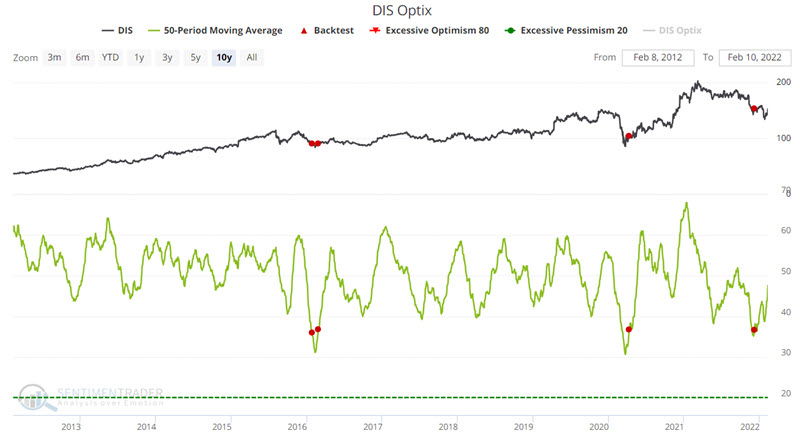
The latest signal occurred on 12/8/2022. Now let's take a closer look at historical results and how this signal might be used to trade DIS.
Results
The table below displays a summary of performance for DIS following the Optix generated signal above.
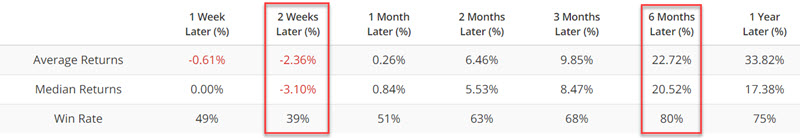
There are two key things to note in the table above:
- Performance during the 2-weeks after a signal has typically been poor, with only a 39% Win Rate and a Median Return of -3.10%
- On the other hand, performance during the full 6-month period after a signal has typically been quite favorable, with a solid 80% Win Rate and a robust Median Return of +20.52%.
So, let's test out a strategy that waits two weeks after each signal before getting into Disney stock and then holds that position until six months after the signal. To emulate this approach, we will use the following rules:
- Each time DIS 50-day Optix crosses above 36, we will wait ten trading days (roughly two weeks) and then buy and hold for 116 trading days (116 + 10 = 126, which equates to 21 trading days per month * 6 months).
- If a new signal occurs while a previous signal is still active, the holding period is extended for another six months.
The chart below displays the hypothetical cumulative growth of $1 invested in DIS only under the abovementioned rules.
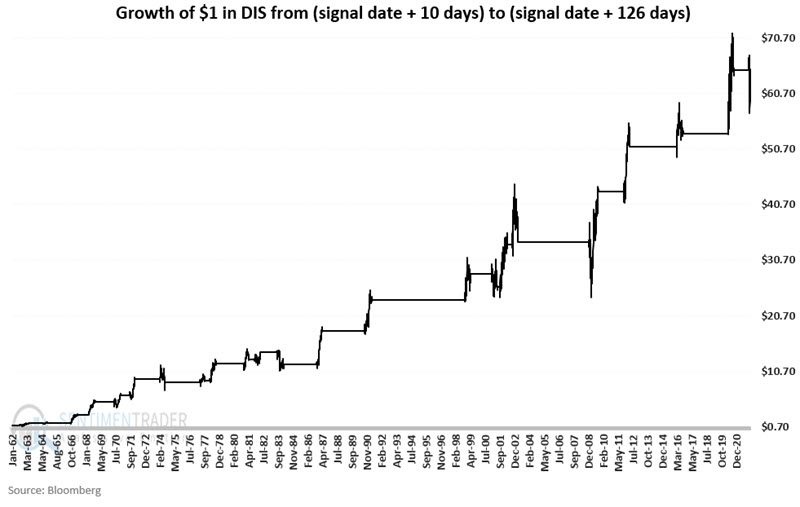
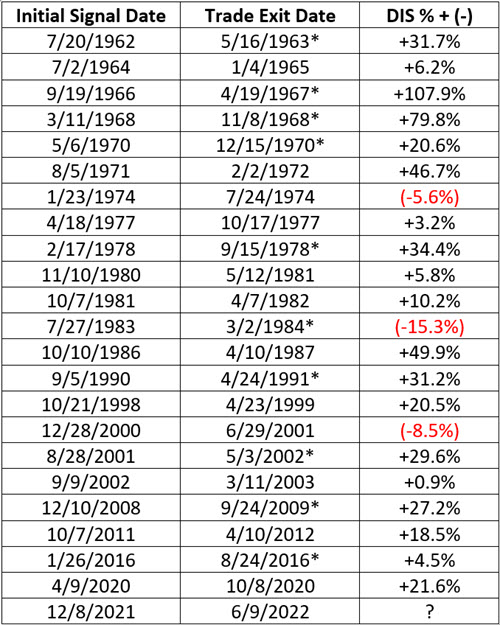
The table below displays the trading dates and DIS returns using the rules above.
- The date in the left-hand column is the date of the initial cross above 36 for the DIS 50-day Optix
- The trade entry date would be ten trading days later (not shown).
- The date in the middle column is 126 trading days after the last signal.
- If the date in the middle column displays an "*", it means more than one signal occurred, which extended the holding period beyond 126 trading days from the original signal date
- The DIS % + (-) column displays the total return for DIS stock during the favorable period
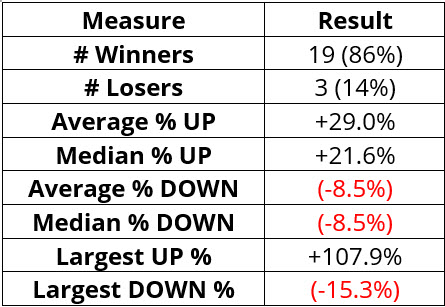
 The table below displays a summary of the hypothetical trades above.
What the research tells us…
Sentiment tends to follow price. When a stock or index declines in price, it is often simply a function of human nature that sentiment declines as well. This "washing out" of investor sentiment can set the stage for the next advance.