
Off the Beaten Path: The Gross Domestic income Edition

Key points
- Real Gross Domestic Income (RGDI) is a broad measure of economic activity
- The 12-month change in RGDI can be used in several different ways to identify potentially favorable periods for stocks
- When the 12-month change in RGDI either drops to negative and then reverses, or stays positive for a sufficient period of time, stocks have tended to react positively
First, a word on "relevance"
Roughly 98% of the time, I strive to make the note I am writing about topical, or relevant to today's market and/or upcoming opportunities. To be clear, this is not one of those. The other 2% of the time, I pull items from the "knowledge base" to highlight information I believe most readers are not aware of. This note is part of that 2%. Hence, this note is labeled "Informational" rather than "Actionable." That said, I look at markets from different angles and identify analytical methods that many might never consider. This one also fits into that category.
Real Gross Domestic Income (RGDI) is an economic measure
Most individuals - even non-investors - are familiar with the term "Gross Domestic Product", or GDP. Far fewer are familiar with Gross Domestic Income. Gross Domestic Income is an alternative way of measuring the nation's economy. For analysis, we will use a data series titled "Real Gross Domestic Income (RGDI)" that measures the income earned and the costs incurred in producing gross domestic product.
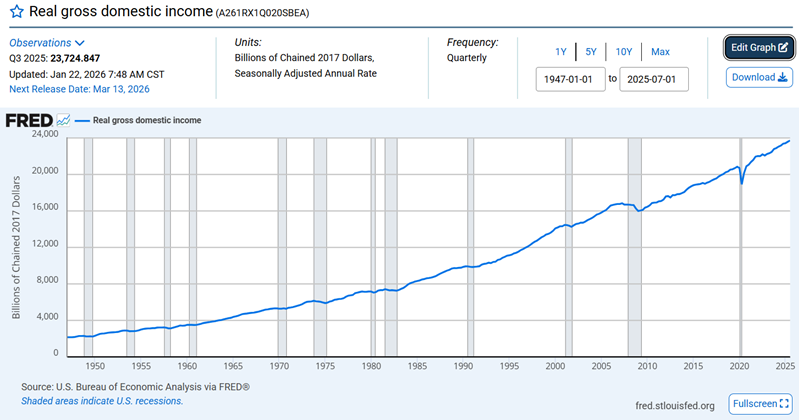
This data series is reported quarterly, with a significant lag. For example, the results for Q3 of 2025 were reported on 2026-01-22. The Q4 2025 update is scheduled to be released on March 13th, 2026. So, this is not exactly a "hot read" on the economy or a precision market-timing tool (although it does have some value in that regard, as we will see). The chart below displays the cumulative values for the index since 1948.
The chart below shows the 12-month percentage rate of change for the indicator. Note that this value has been positive since the quarter ending March 31st, 2021.
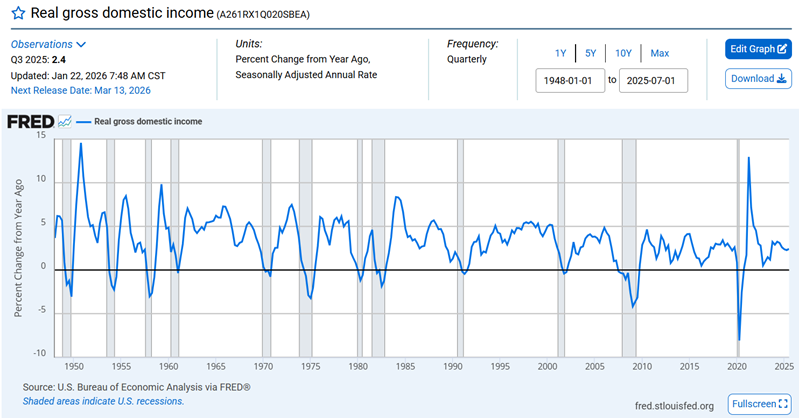
So, what to make of all the squiggles? I have found two ways to apply this indicator to the broader stock market. Let's consider them individually, then combine them.
For testing purposes, we evaluate data at the end of the quarter, when the data is reported. For example, Q4 2025 data will be reported on March 13th, 2026. We will evaluate those results on March 31st, 2026. If a "buy" signal occurs, we would use the S&P 500 closing price for March 31st as the entry price.
Method #1: When RDPI goes negative and then reverses
Our first application involves two steps:
- The 12-month RGDI % change drops to negative
- Then wait for a reversal higher
That's it. Of course, since we are talking about quarterly data, this process can take a long time to play out. Note that holding periods can last more than 4 quarters if the 12-month RGDI % change dips after an initial signal and then reverses higher.
The most recent signal occurred during the quarter ending December 31st, 2020. This resulted in a favorable signal that lasted through December 31st, 2021.
Now, let's consider S&P 500 performance following occasions when RGDI fell into negative territory and then reversed higher. For testing purposes, we will assume that the S&P 500 is bought and held for four quarters (i.e., 12 months) after the pattern occurs.
The chart below displays the hypothetical growth of $1 invested in the S&P 500 only during these periods.
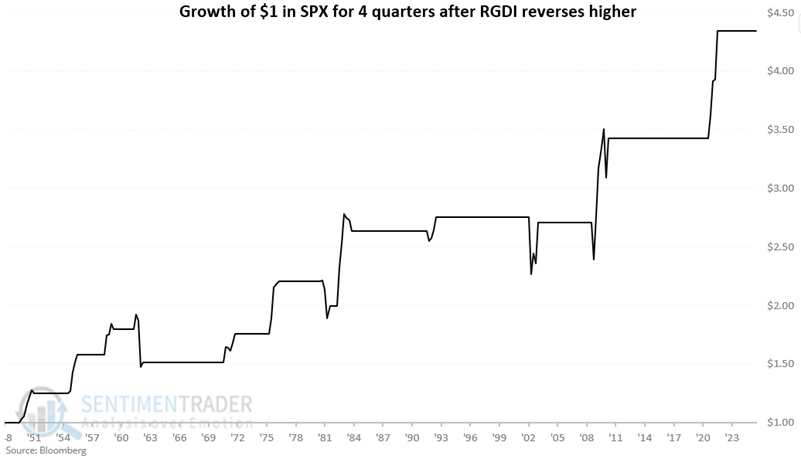
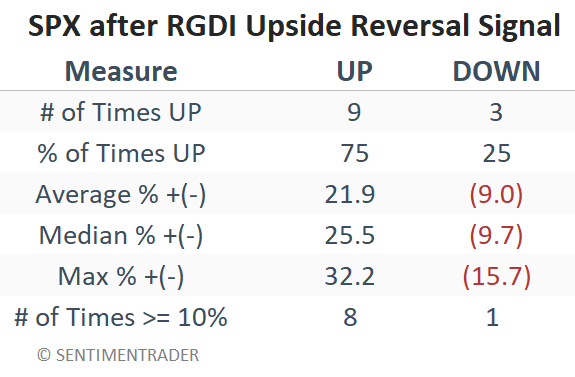
While we don't recommend this as a standalone trading system, the table below summarizes results as if we did.
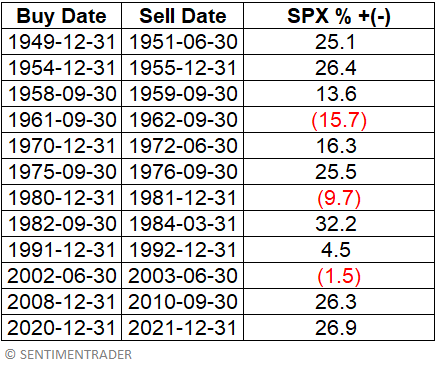
The table below summarizes the S&P 500 performance during the periods listed above.
Method #2: When RDPI remains positive for a prolonged period
Our second is even simpler:
- Wait for the 12-month % change in RGDI to be positive for 14 consecutive quarters (i.e., for 2.5 years)
- Then buy and hold the S&P 500 for four quarters (i.e., 12 months)
The table below displays the hypothetical growth of $1 invested in the S&P 500 only during these periods. The most recent signal occurred during the quarter ended June 30th, 2024. This marked the 14th consecutive quarter of positive readings, which began in the first quarter of 2021. This resulted in a favorable signal that lasted through June 30th, 2025.
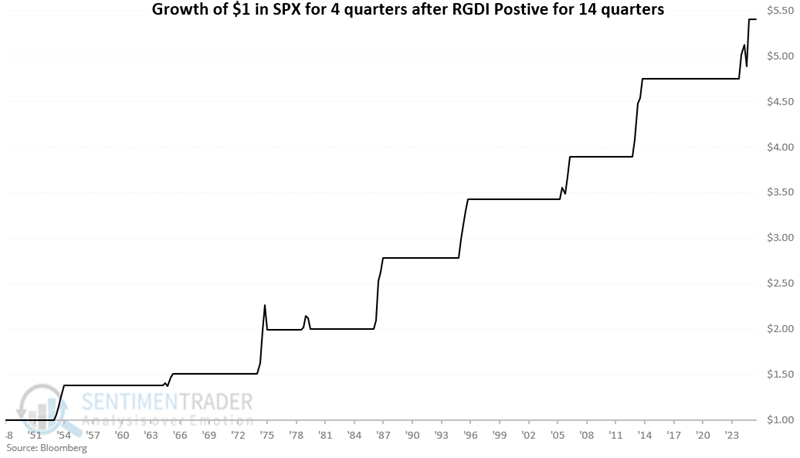
While we also don't recommend this as a standalone trading system, the table below summarizes results as if we did.
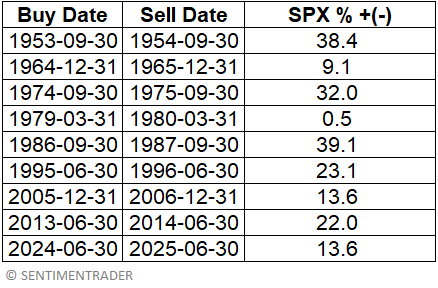
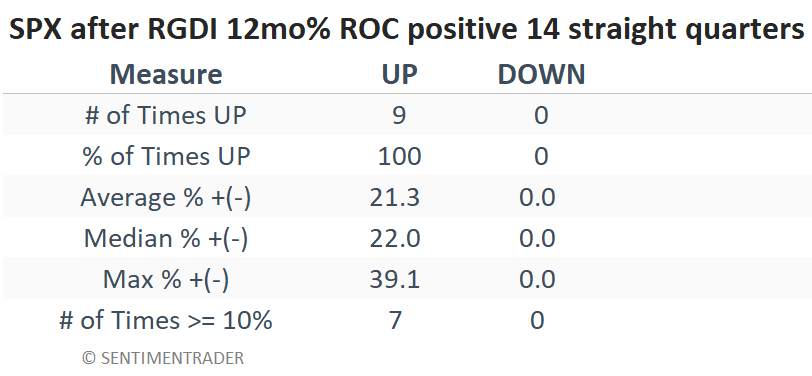
The table below summarizes the S&P 500 performance during the periods listed above.
Combining the two methods
Under the "combined" method, anytime the 12-month % change in RGDI:
- Drops to negative and then reverses higher
- OR remains positive for 14 consecutive quarters
- Buy and hold the S&P 500 for 4 quarters
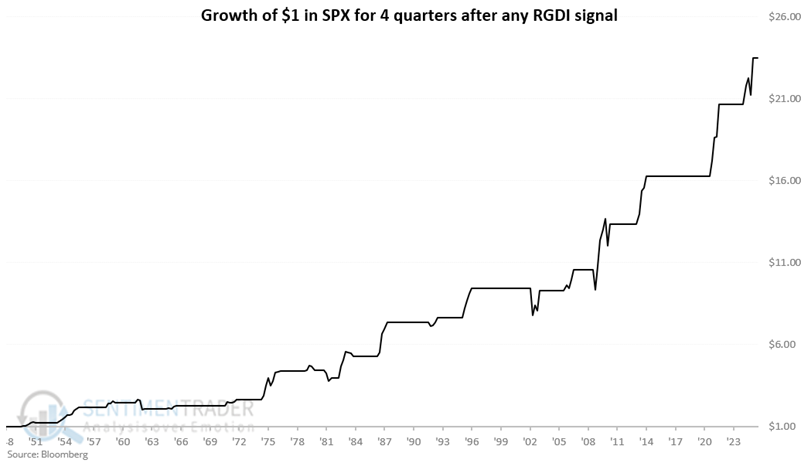
The periods described above are considered "bullish" for stocks. However, please keep in mind that no inference is made about market performance during any other period. In other words, in the absence of a signal from this model, the stock market is considered "neutral" (no opinion, neither bullish nor bearish) rather than "bearish."
The table below displays the hypothetical growth of $1 invested in the S&P 500 only during these periods.
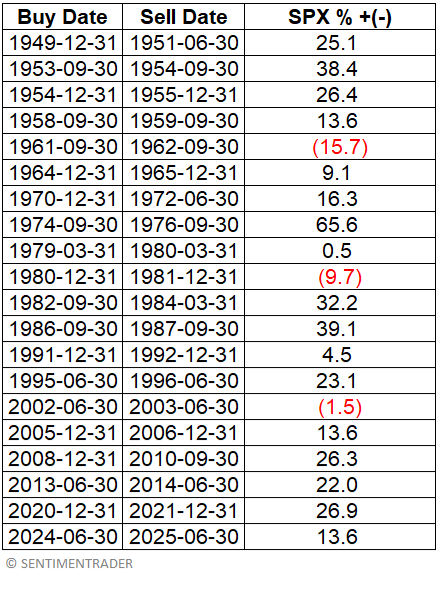
While we don't recommend this as a standalone trading system, the table below summarizes results as if we did.
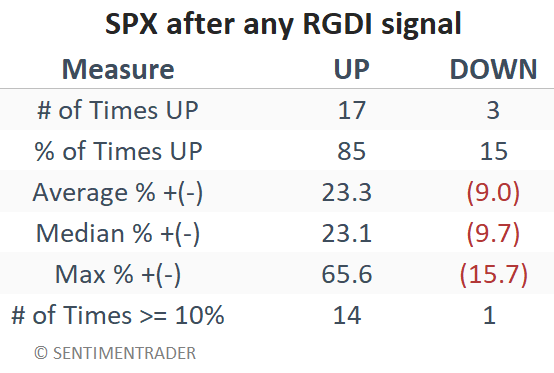
 The table below summarizes the S&P 500 performance during the periods listed above.
What the research tells us…
The good news is that when the 12-month change in Real Gross Domestic Income either bounces off a negative low or holds positive for an extended period, the likelihood of a bull market for stocks has historically been high. The bad news is that it does not appear to have much (if any) value as a "Sell" signal. Likewise, it is nowhere near giving a signal anytime soon. To get a new signal from here, the 12-month change in RGDI would have to fall into negative territory for at least one quarter and then reverse higher in a subsequent quarter.
My apologies for the lack of "timeliness" on this one. But do remember the next time you hear a gloom-and-doom pundit lamenting the negative year-over-year results for Gross Domestic Income as some sure-fire sign of recession, to start preparing your buy list.