Odd Breadth Day

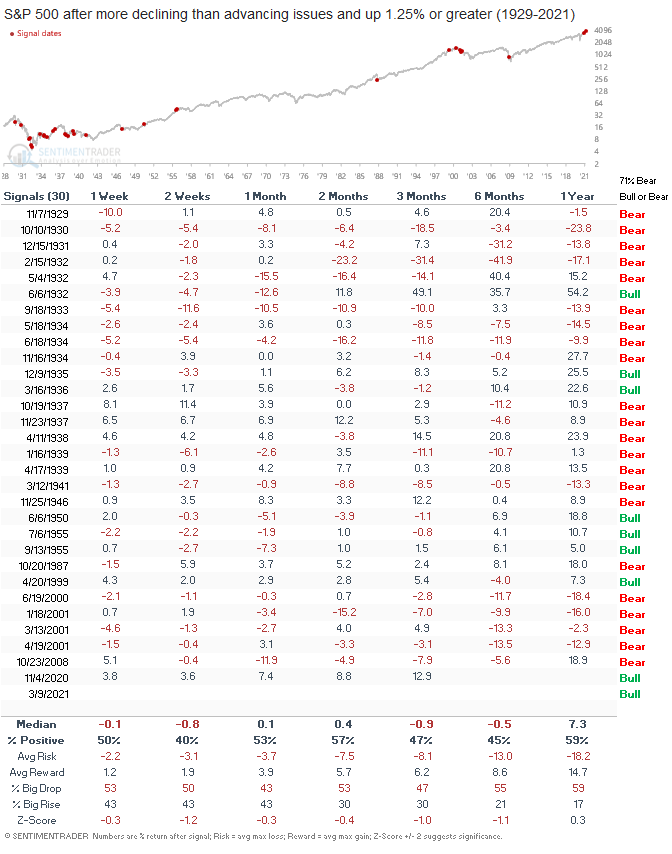
The S&P 500 rose more than 1.4% on Tuesday, and yet breadth for the Index was negative, with more issues declining than advancing. If I lower the daily gain to 1.25%, that's happened 30 other times since 1929. What's really interesting is that most of the instances occurred in bear markets. The last column in the table below designates whether a signal occurred in a bull or bear market. If we assume the closing high in the S&P 500 on 2/12/21 was not the top, 71% of the instances occurred in a bear market.
The internal rotation taking place in the market from stay-at-home (growth) to recovery (value) is meaningful. Jason and I highlighted the shift in notes on Tuesday. Please see "Big Picture Value vs. Growth Signal" and "A near-record month for value vs. growth." This internal tug of war creates some odd short-term breadth stats, and this one is no different.
Let's look at forward returns for historical instances when the daily gain in the S&P 500 is strong, and breadth is weak.
All Signals
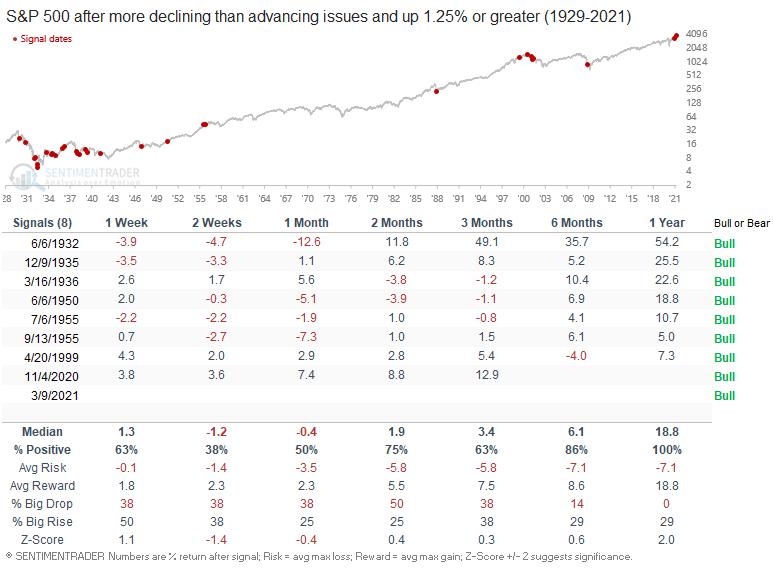
Obviously, the bear market instances weigh on the forward returns. Let's look at the forward returns for instances in a bull market.
Bull Market Signals
While the sample size is smaller, the returns look much better on an intermediate to long-term basis. With the second weak breadth day in a little over 4 months, do we see the market resolve higher like 1955 or 1935/36?