
October was a down month, and why that's a good thing

Key points
- The S&P 500 closed lower for the month of October
- This ended a streak of five consecutive up months
- The stock market tends to perform well after this "pause that refreshes."
Momentum is a real thing in the stock market
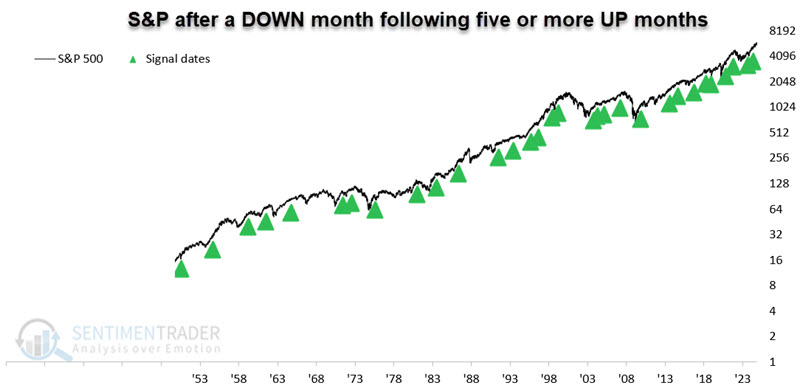
As detailed in this article dated 2024-10-01, the stock market tends to perform well after registering five consecutive up months. In other news, the end of such a winning streak is typically not an unfavorable omen. The chart below highlights the down months for the S&P 500 that marked the end of a five-month or more winning streak starting in 1950. Another new signal occurred at the close on 2024-10-31.
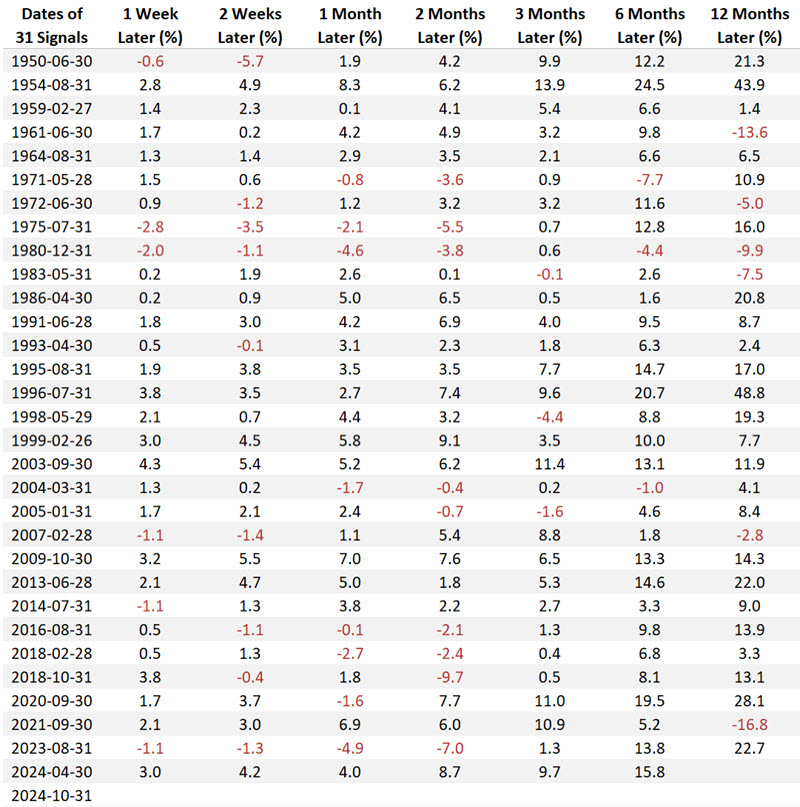
The table below displays S&P 500 performance following a down month that markets the end of a five or more-month winning streak.
The table below summarizes all the results from the table above. Results were particularly robust for three and six months after a signal.
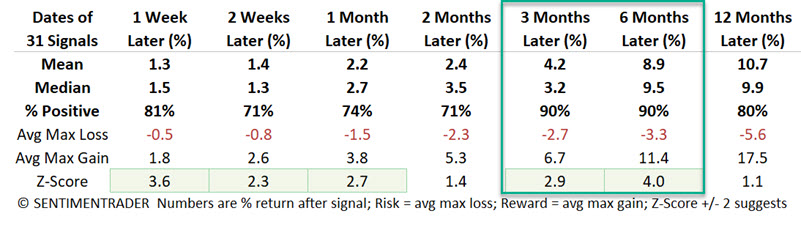
The table below summarizes the results for six-month returns following the signal dates highlighted in the table above.
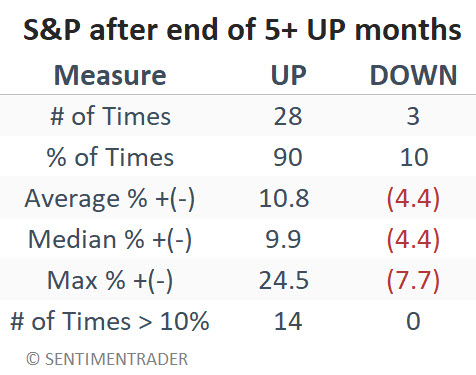
Clearly, the results (90% Win Rate and 14 to 0 to the positive for 10%+ moves) skew to the positive side. This suggests giving the bullish case the benefit of the doubt through April 2025.
A separate word on "real-world" trading
The data analysis above suggests allocating some capital to an S&P 500 index fund or ETF for the next six months. However, there is data analysis, and then there is actual trading with real money on the line. Never forget that these are two different things. Regardless of the outcome of any backtest, the real question is, "Can you hold the trade long enough to achieve the anticipated benefit?"
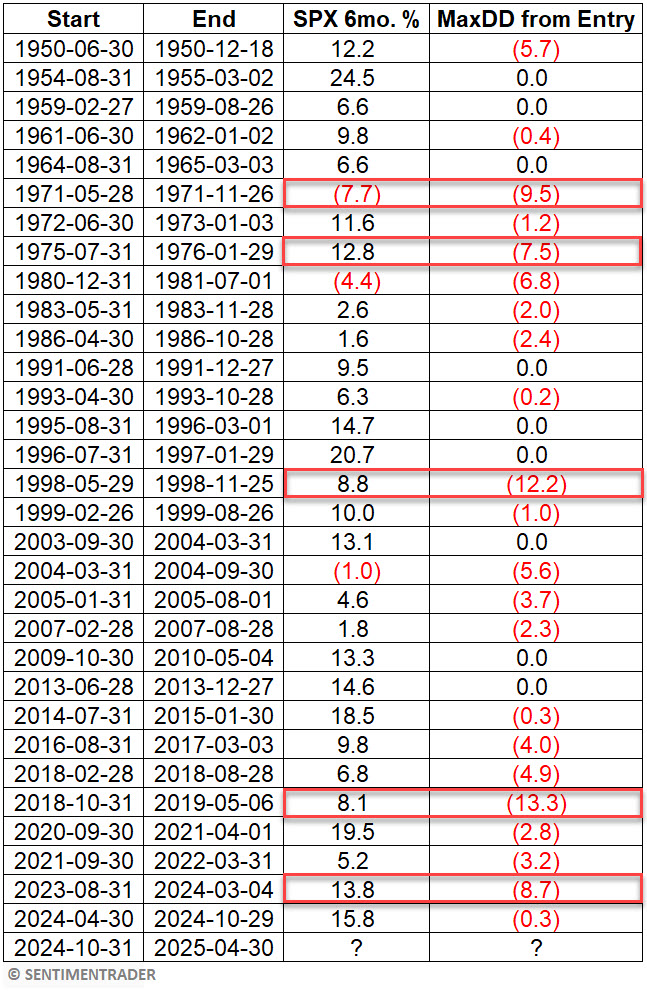
So, let's assume we plan to buy and hold an S&P 500 index fund for six months following each of the dates listed above. The table below displays the end result, i.e., the six-month performance for the S&P 500 Index and the maximum drawdown from the point of entry that a trader would have had to endure to achieve the six-month return.
The table below displays those results. The column labeled "MaxDD from Entry" shows the largest open loss from the entry price a trader would have had to ride out to achieve the return listed in the column labeled "SPX 6mo. %." The key thing to ponder is the outliers highlighted in red.
In the William O'Neil classic "How to Make Money in Stocks," he suggested cutting a loss on an individual stock purchase if the loss exceeded 7%. The red boxes in the table below highlight those times when the maximum open loss exceeded -7 %. In four cases, the S&P bounced back and closed higher after six months (by +12.8%, +8.8%, +8.1%, and +13.8%). In the other case, the S&P ended down -7.7%.
For the record, the largest drawdown for the S&P 500 from an entry price within six months of a signal was -13.3% following the 2018-10-31 signal.
So, critical questions for any investor looking at this market quirk are "how much to allocate?" and "if and where to place a stop-loss."
What the research tells us…
If history proves to be an accurate guide, the odds appear good that the S&P 500 will close April 2025 higher than it did in October 2024. Of course, that's the catch with market history. It is not always an accurate guide. Nevertheless, at the very least, the information above falls firmly on the favorable side of the ledger for stock prices and suggests that investors continue to give the favorable case the benefit of the doubt.