
NYSE stocks are losing their long-term uptrends

Key points:
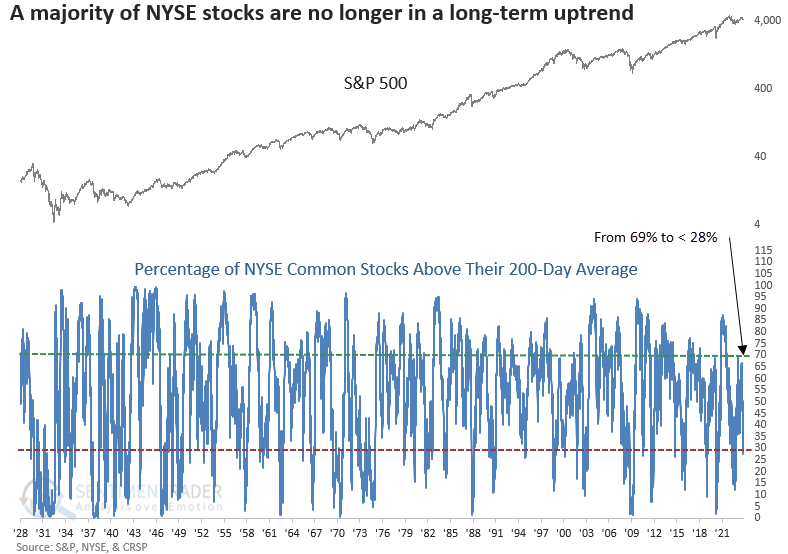
- The percentage of NYSE stocks above their 200-day average cycled from above 69% to less than 28%
- Similar shifts in long-term uptrends led to an S&P 500 rally, but the results were lackluster
- When the indicator is oversold and falling, like now, the S&P 500 shows negative annualized returns
Long-term uptrends for a broad basket of stocks continue to dwindle
In December 2022, I published a research note highlighting a bullish reversal in the percentage of NYSE common stocks above their 200-day average. The study was just one of numerous recovery and breadth thrust signals triggered following the low last October, indicating a new cyclical upswing in the stock market.
Despite the S&P 500 registering a maximum gain of 12.6% over the following ten months and the percentage of NYSE common stocks above their 200-day average climbing to 69%, recent developments have seen long-term uptrends suffer a significant decline.
On Tuesday, the percentage of NYSE commons stocks above their 200-day average fell below 28%, a level reached only 17% of the time since 1928.
Similar reversals in long-term uptrends led to lackluster results
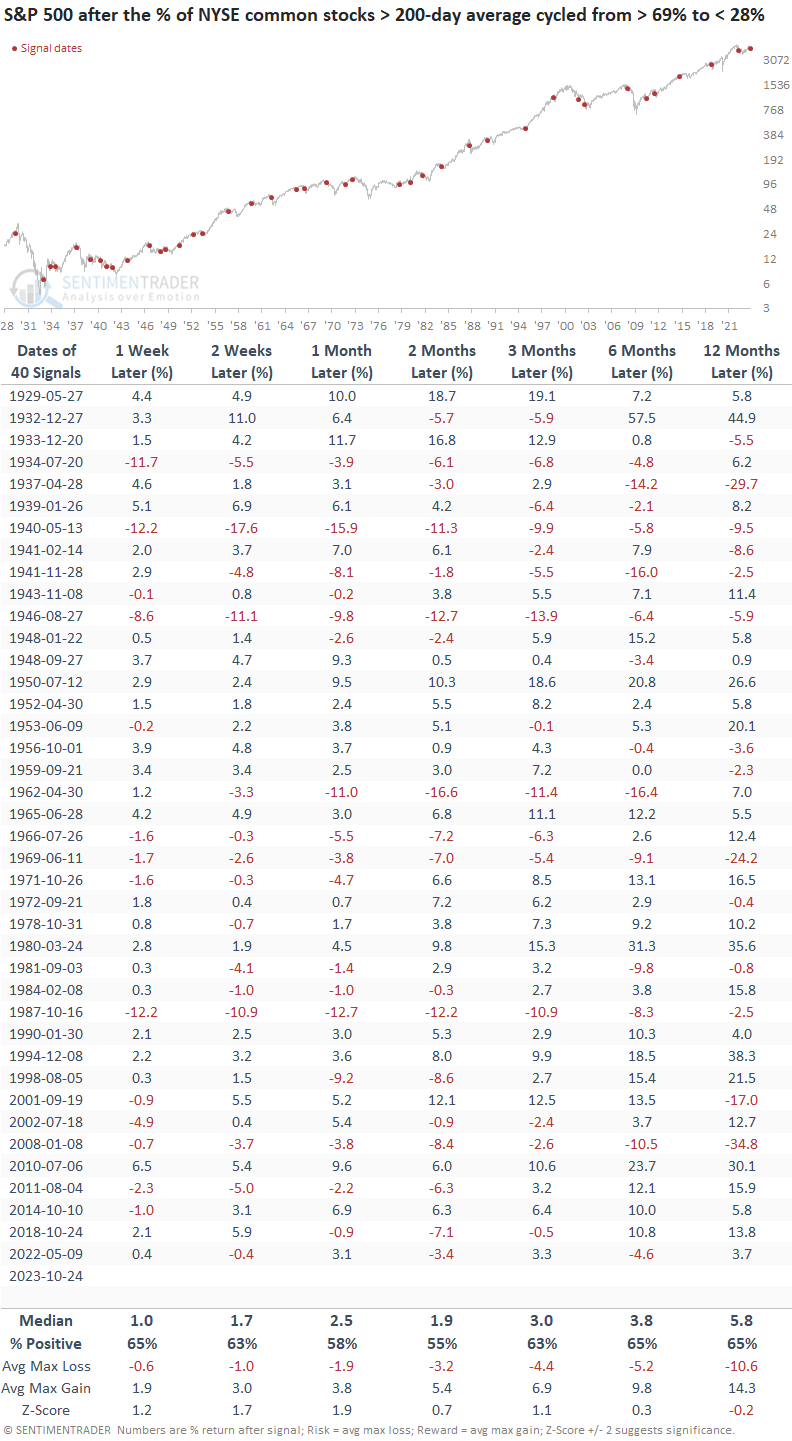
When the percentage of NYSE common stocks trading above their 200-day average cycled from greater than 69% to less than 28%, the S&P 500 typically saw a rally. However, the resulting returns, win rates, and z-scores were unimpressive, mirroring the typical outcome when a breadth-based indicator declines into an oversold condition.
Since 1962, 16 out of 22 precedents showed a negative return at some point in the first two months.
The danger of buying an oversold condition
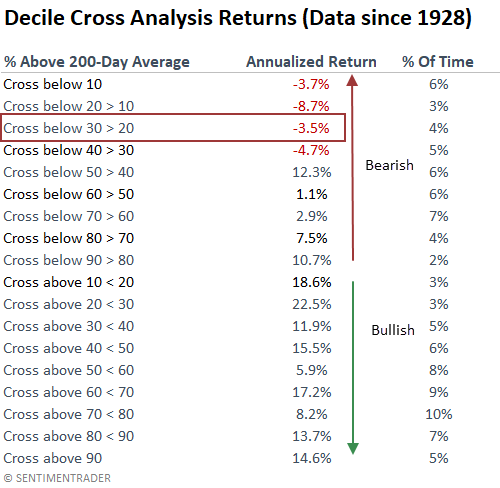
Generally, annualized returns tend to be bearish when a breadth-based indicator declines toward oversold territory. Conversely, when it starts to rise from the oversold condition, returns see a notable improvement.
Over the years, I've consistently emphasized the importance of not catching a falling knife, and this table provides a compelling illustration of the rationale.
Similar analogs to the current environment
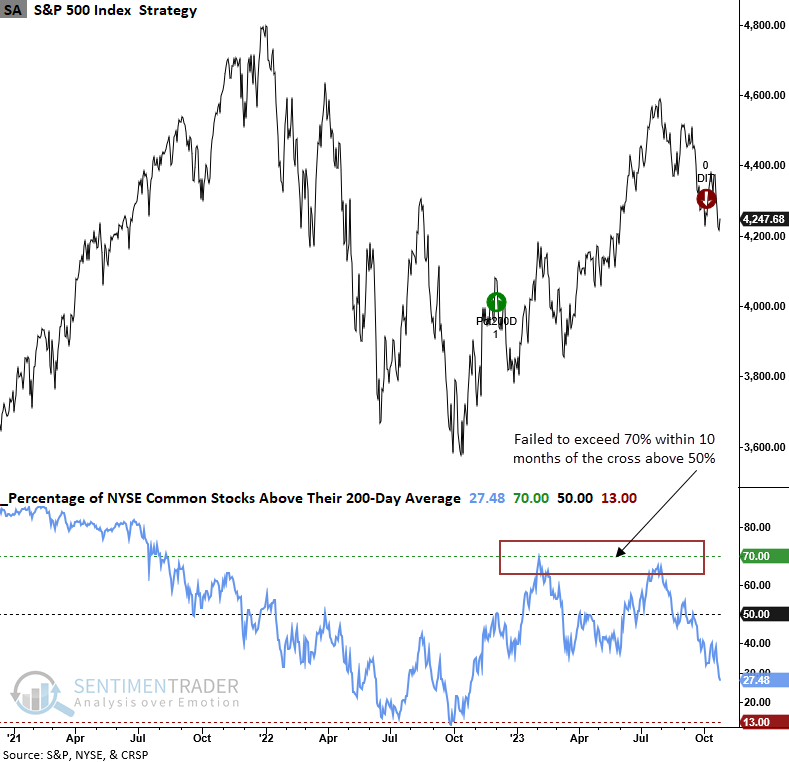
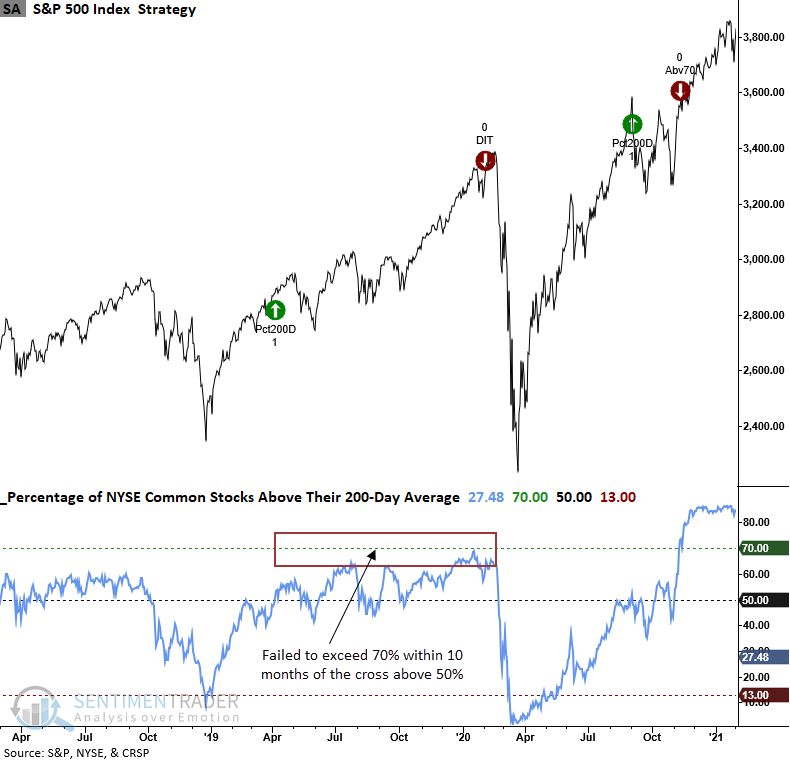
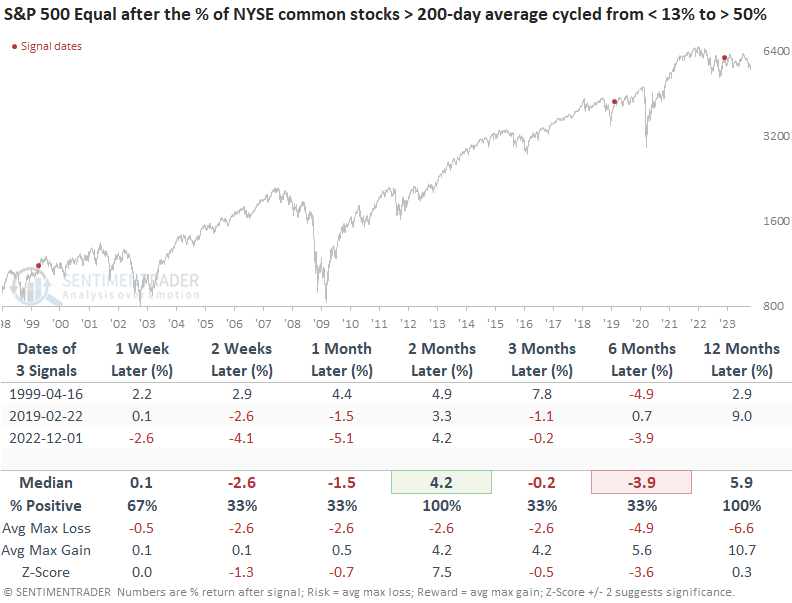
Historically, when the percentage of NYSE common stocks above their 200-day average reverses from less than 13% to above 50%, the recovery signal I shared in December, the indicator almost always continues to rise and exceed 70%. However, the upward trajectory for this most recent precedent stopped short of that critical level. I can find only two other times when the indicator failed to exceed 70% within ten months, a time frame similar to now. Those instances occurred in 1999 and 2019.
After the 2019 reversal signal, the S&P 500 continued to rise as the percentage of stocks in an uptrend gyrated between 41% and 68%.
The 1999 signal looks similar to the current environment, with the indicator falling to 26% in February 2000.
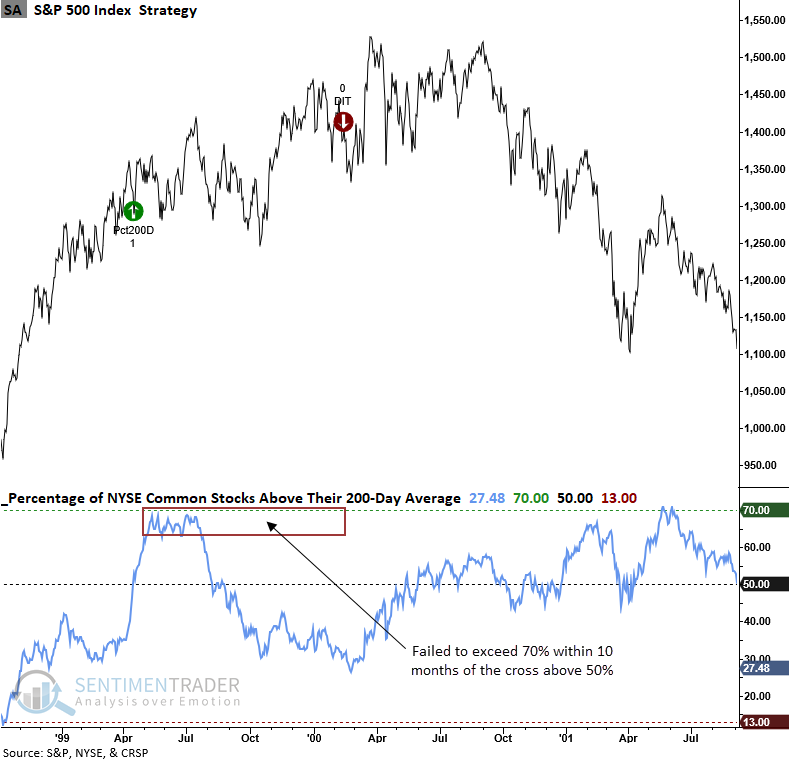
While drawing conclusions from a small sample size is always dangerous, the current environment is tracking the 1999 analog more closely at the six-month mark. I applied the equal-weighted S&P 500 index to the outlook table because, in both cases, the average stock struggled relative to the capitalization-weighted version of the S&P 500.
In 1999, Technology was driving the S&P 500, and now it's the magnificent 7.
What the research tells us...
Just about every market breadth indicator is showing fewer and fewer stocks participating in uptrends. Eventually, the participation problem will culminate in an oversold condition that entices investors to increase market exposure. Until then, one cannot rule out additional downside, as the percentage of NYSE stocks in an uptrend threshold table clearly illustrated. When an oversold condition emerges, we should monitor individual stocks for signs of relative strength and watch for signs of a broad market reversal.