
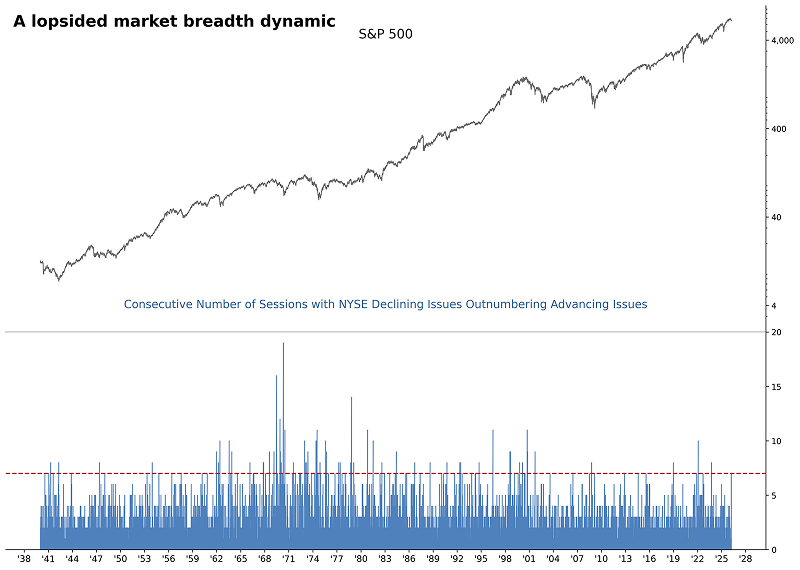
NYSE Breadth is leaning toward the negative side

Key points:
- Declining issues on the NYSE outnumbered advancing issues for seven consecutive sessions
- Similar advance-decline dynamics led to lackluster returns over the subsequent 2 weeks
- When the lopsided streak occurs in an uptrend, the outlook remains stagnant over the same horizon
What, if any, insights can we derive from the skewed NYSE breadth?
When considering breadth-based indicators for exchanges, we prefer the NYSE rather than the Nasdaq. The NYSE contains a more substantial collection of high-quality stocks and bond proxies, thus offering us two market insights.
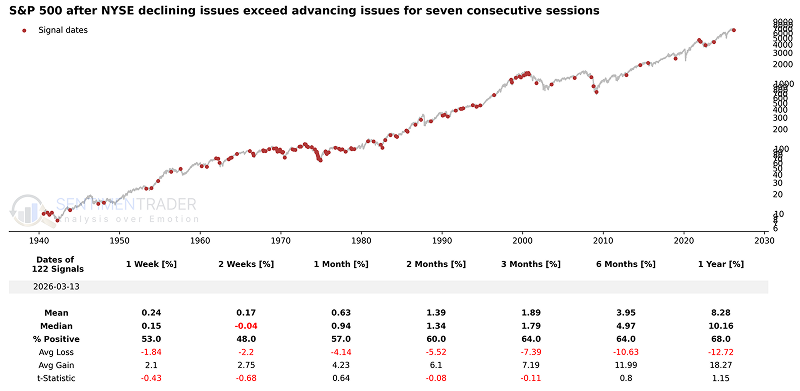
Over the past few trading days, the seven sessions have marked a rare period of sustained downside breadth on the NYSE.This dynamic has only occurred 1% of the time since 1928.
Comparable stretches of skewed breadth led to uninspiring returns
With decliners outpacing advancers for seven straight days-a scenario seen just 1% of the time-history suggests a muted response from the S&P 500 over the following two weeks. Median returns during this period have consistently lagged the broader historical baseline.
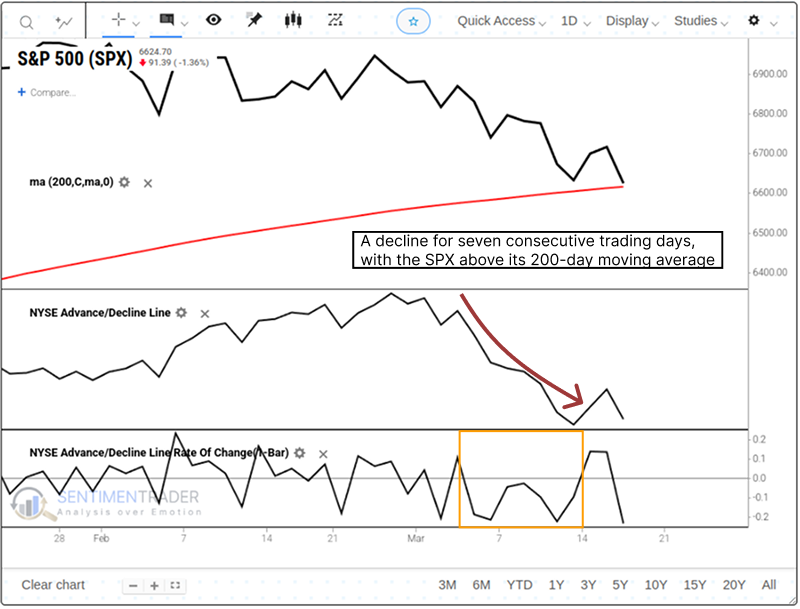
Signals in an uptrend
Let's add some context. We will now require the S&P 500 to close above its 200-day average, signifying an uptrend similar to now. As we can see from the recent action, the index has experienced this decline while still maintaining its position above the long-term moving average.
When NYSE breadth is negative for seven consecutive sessions, and the S&P 500 is above its long-term average, returns are still lackluster over the subsequent 2 weeks.
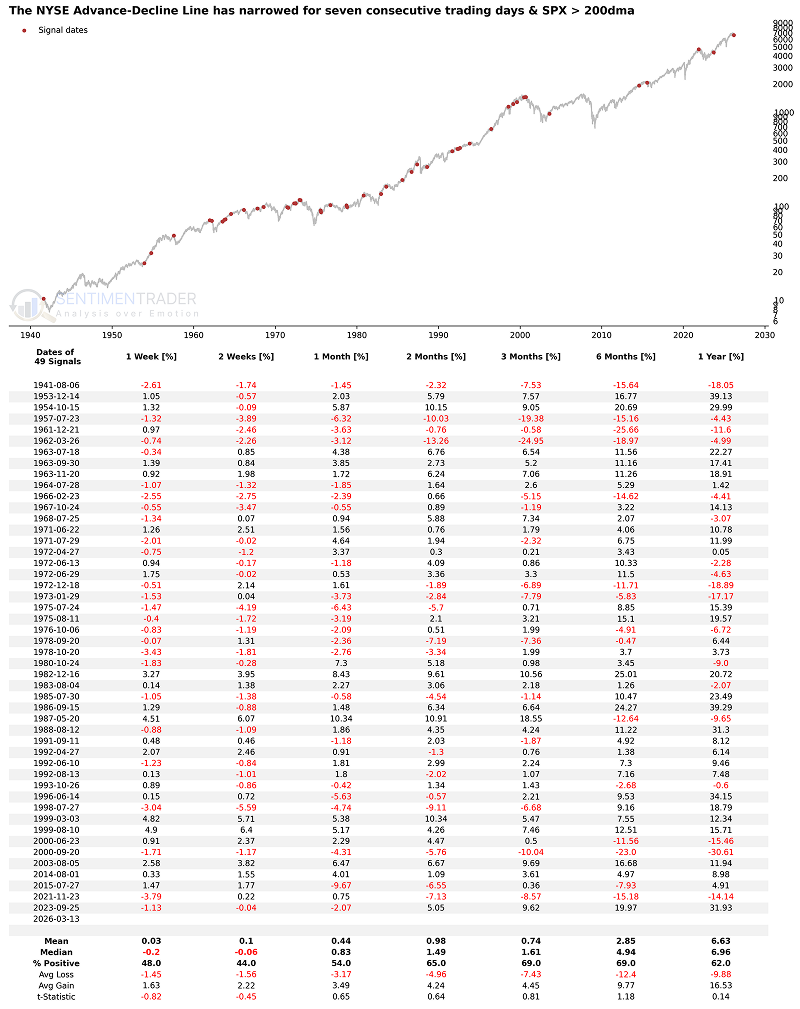
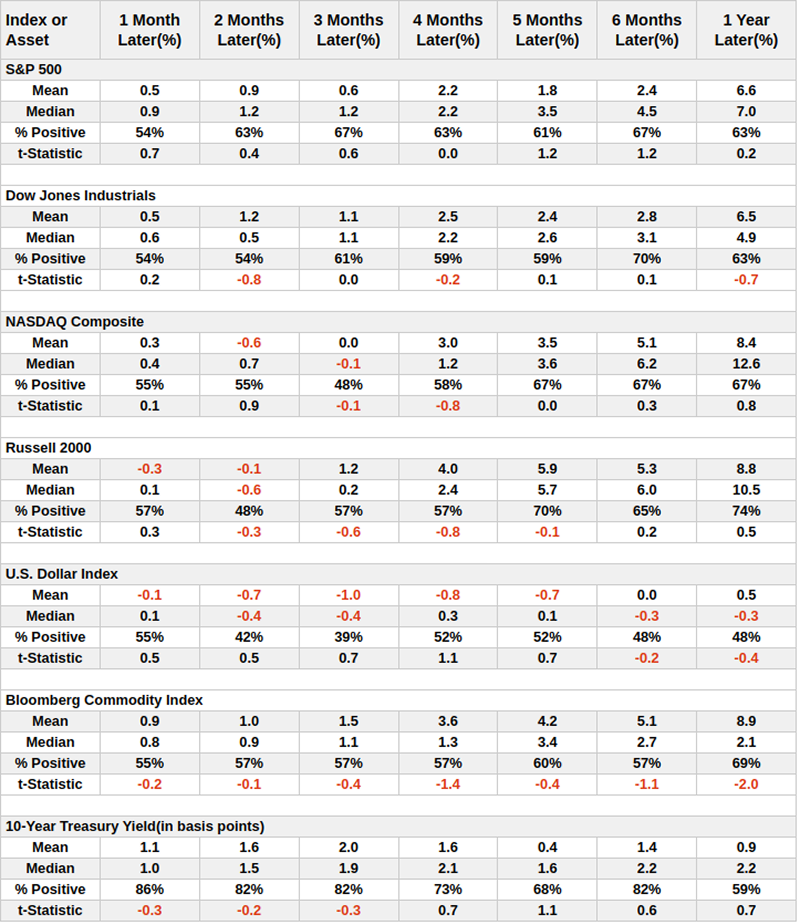
This sluggishness extends beyond just large-cap stocks. When we look at how other major indices and asset classes perform following these breadth signals, the near-term weakness is evident across the board.
Conversely, the 10-Year Treasury Yield has an exceptionally high probability of rising in the short term, potentially explaining the continued pressure on stocks.
What the research tells us...
NYSE advance-decline breadth has been skewed in favor of declining issues over the last seven sessions, reaching a point rarely seen in history. Typically, a mean reversion bounce back occurs when participation measures tilt one way for too long. However, while the S&P 500 might see a brief rally, forward returns are lackluster over the subsequent 2 weeks and often underperform relative to history. Rising 10-Year Treasury yields may compound this sluggishness. Historically, yields have shown a strong tendency to climb following these breadth signals, creating a continued headwind for equities. Ultimately, the broader market may need to fall further, creating a more meaningful oversold condition that entices buyers.