
Now is not the time to ignore Energy seasonality

Key points:
- There are valid reasons why the energy sector has performed exceptionally well, and to believe that the trend can persist
- Likewise, a near-term seasonal trend suggests potential strength in the weeks ahead
- However, the broad energy sector, energy services, and energy exploration all have a long history of trending sideways to lower during the summer
- In addition, sentiment could be waving a yellow flag of its own
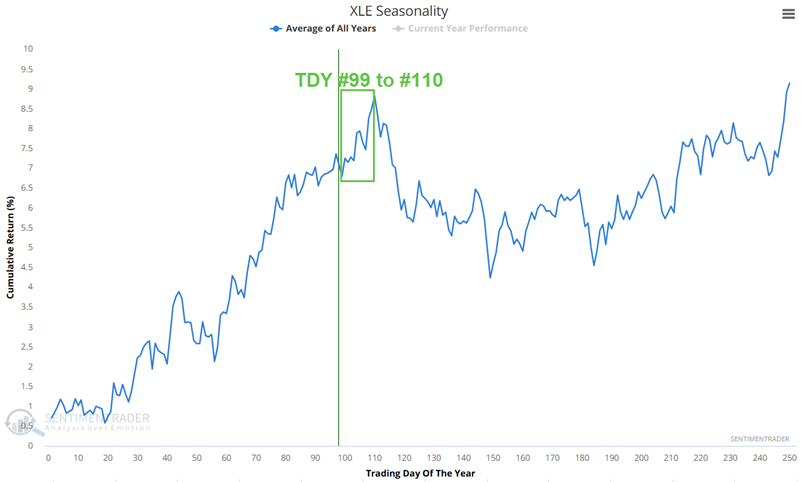
The broad energy sector (ticker XLE) enters a key time of year
The chart below displays the Annual Seasonal Trend chart for the State Street Energy Select Sector SPDR ETF (XLE), which tracks the S&P 500 Energy sector. The chart highlights the period from Trading Day of the Year (TDY) #99 through TDY #110. For 2026, this period extends from the close on May 26th through June 10th.
The chart below displays the hypothetical growth of $1 achieved by holding a long position in XLE only during this period every year since 1999. This period has shown a gain in 17 of the last 27 years, with a cumulative gain of +63%.