
November S&P 500 performance based on year-to-date results

Key points
- There appears to be some correlation between January through October market performance and performance during November
- As of late October, the S&P 500 Index is still up over 10% for the year
- History suggests that investors root for an October S&P 500 close of 4,223.45 or higher
November performance based on 1st ten months of the year
In the following test, we will look at the November S&P 500 performance based on the Index's performance through the first ten calendar months of the year. Our test period is 1920 through 2022.
We first rank January 1st through October 31st performance from highest to lowest, then note the index performance for the S&P 500 Index during November.
Summarizing results
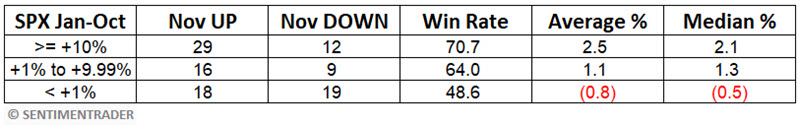
Summarizing results is pretty straightforward. A January-October return of:
- Over +10% has tended to be favorable for November
- +1% to +9.99% tended to be moderately favorable for November
- Less than 1% tended to be unfavorable for November
The table below summarizes the November S&P 500 performance.
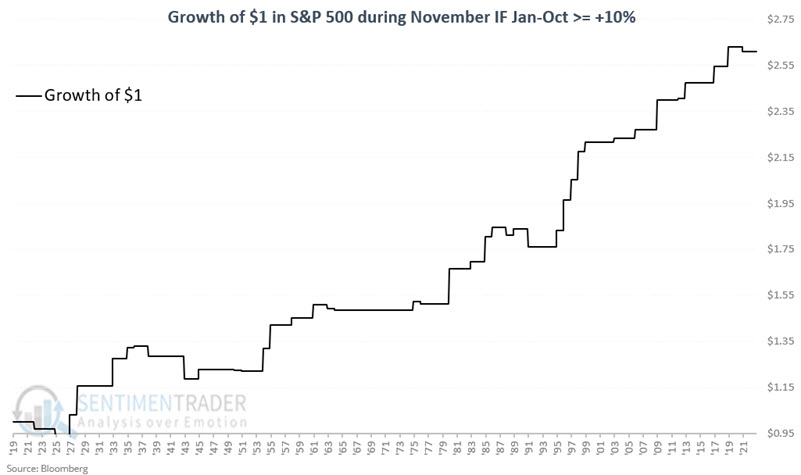
January through October gains of +10% or more
The chart below displays the growth of $1 invested in the S&P 500 Index only during November if the S&P 500 Index showed a year-to-date gain of +10% or more through the end of October.
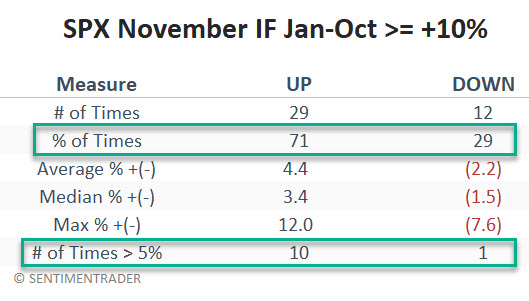
The table below summarizes November S&P 500 performance during these years. The 71% Win Rate tells us that there might be an edge but also that this is by no means a "sure thing." Interestingly, November advances of 5% or more have happened ten times, with only one November decline of -5% or more. This speaks to the tendency for good years in the stock market to re-assert themselves late in the year.
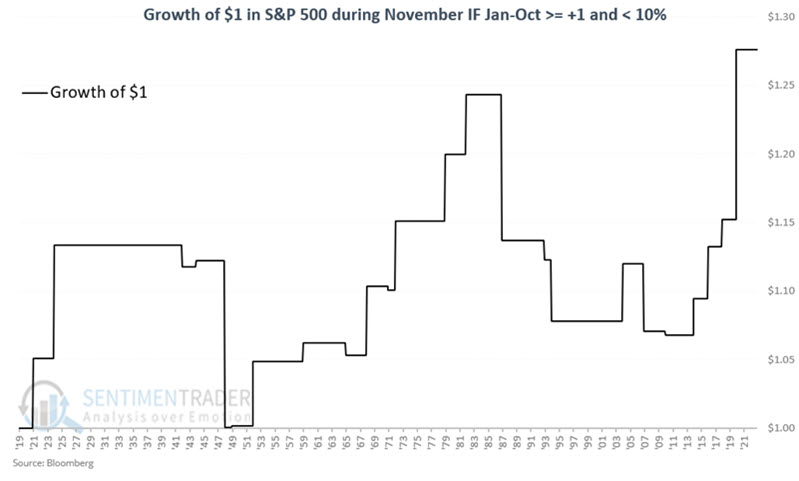
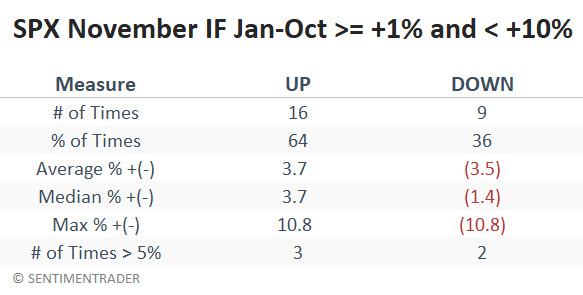
January through October gains of +1% to +9.99%
The chart below displays the growth of $1 invested in the S&P 500 Index only during November if the S&P 500 Index showed a year-to-date gain of +1% to +9.99% through the end of October.
The table below summarizes November S&P 500 performance during these years.
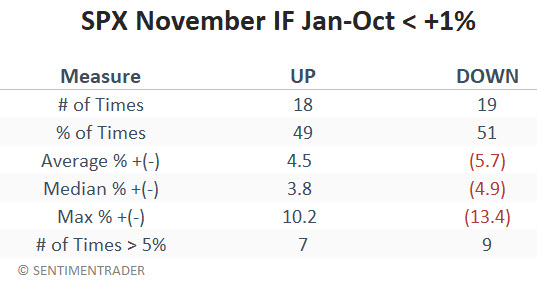
January through October returns of less than +1%
The chart below displays the growth of $1 invested in the S&P 500 Index only during the month of November if the S&P 500 Index showed a year-to-date return of +1% or less through the end of October.
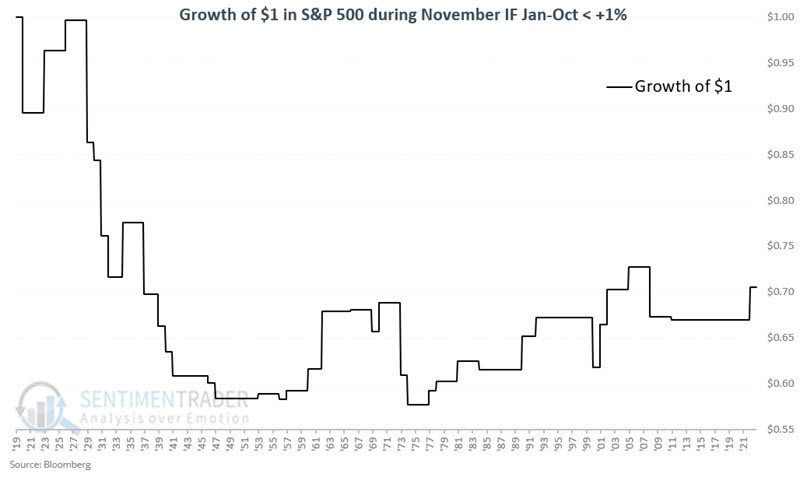
The table below summarizes November S&P 500 performance during these years.
One more to ponder: November AND December, if the S&P 500 is up +10% or more
To close, let's take things one step further and add December returns to the mix. My tweet below displays the growth of $1 invested in the S&P 500 Index during November AND December if the S&P 500 Index showed a year-to-date return of +10% or more through the end of October.
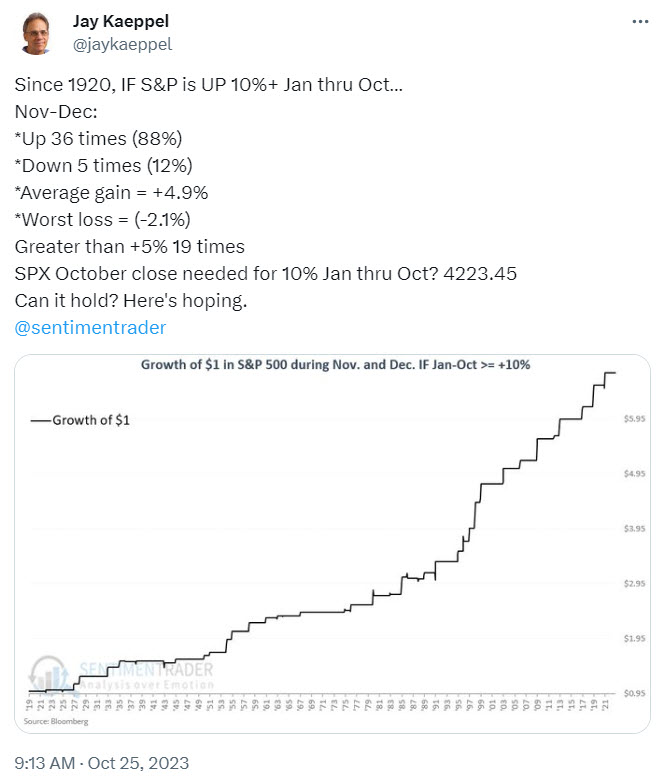
These results add to the suggestion that the end-of-the-year performance tends to be favorable when the overall market has shown significant strength during the first ten months of the year.
What the research tells us…
One old adage in the market states that "strength begets strength." The above results provide a rudimentary example of this concept. It is inaccurate to suggest that there is necessarily a cause and effect at work regarding the November performance based on the January through October performance. Still, history suggests that if the S&P 500 closes October up 10% or more year-to-date, investors and traders might do well to give the stock market the benefit of the doubt during November.
NOTE: The S&P 500 would need to close on October 31st at 4,223.45 or higher to register a 10% January through October gain. Here's hoping.