
November approaches - does it matter?

Key points
- November approaches - what does it mean for the stock market?
- November through April tends to be favorable for stocks, more often than not
- Below we examine a variety of calendar and political/election-related quirks during this critical time of year
The stock market meets October 31st
The legendary Yale Hirsch, founder of the Stock Traders Almanac, first popularized the "Best Six Months of the Year" phenomenon, which purportedly extends from the close of October 31st each year through the close of April 30th of the following year.
Is there really anything to it? And if so, how much does it matter today? Let's examine the history. We will analyze the performance of the S&P 500 Index during the post-WWII era, i.e., starting in late 1945.
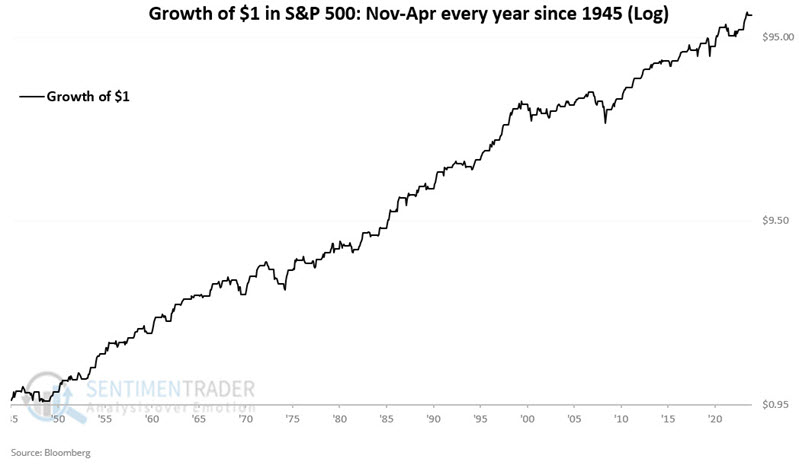
The chart below displays the hypothetical growth of $1 in the S&P 500 only during November through April every year starting in 1945. $1 grew to $125.63.
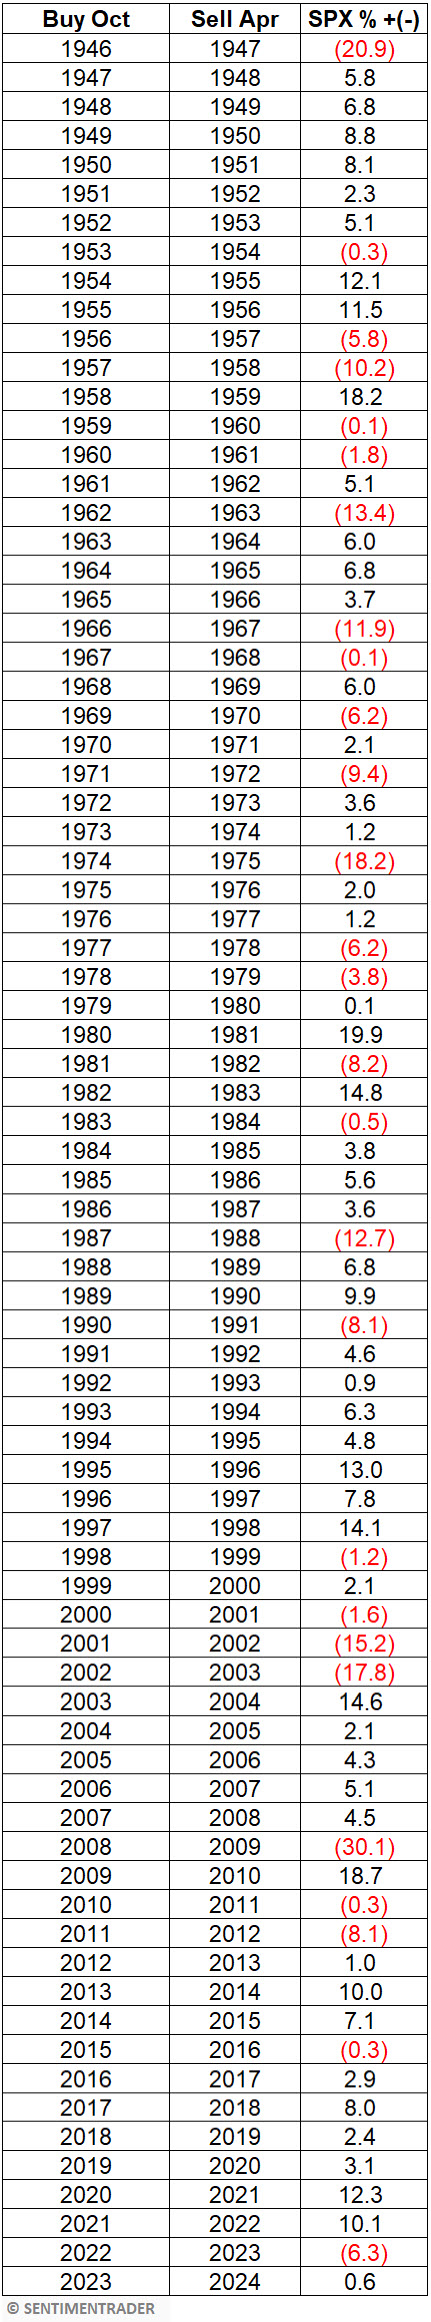
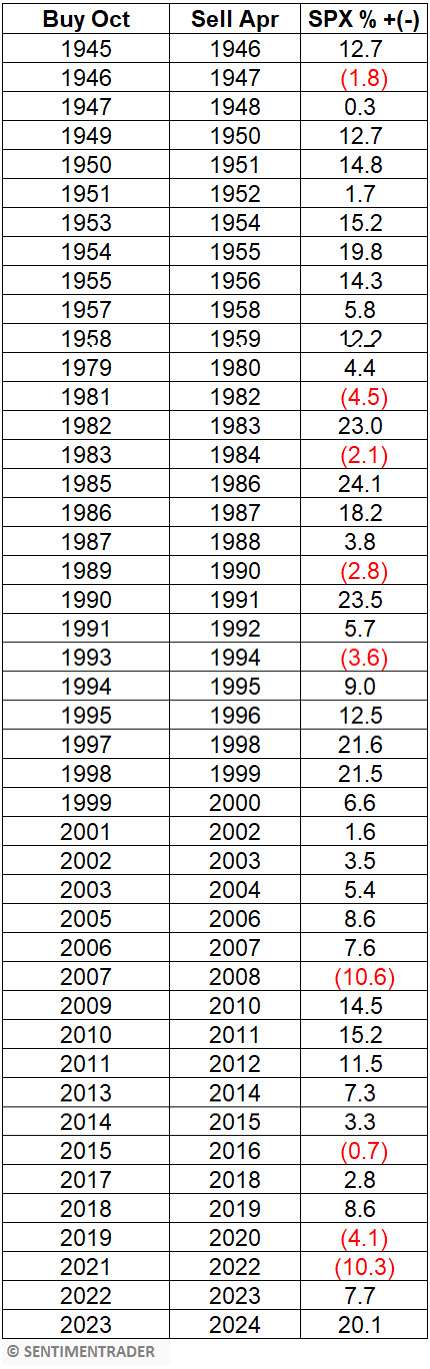
The table below displays forward returns for the S&P 500 during ALL years if bought at the close on the last trading day of October and held through the following April.
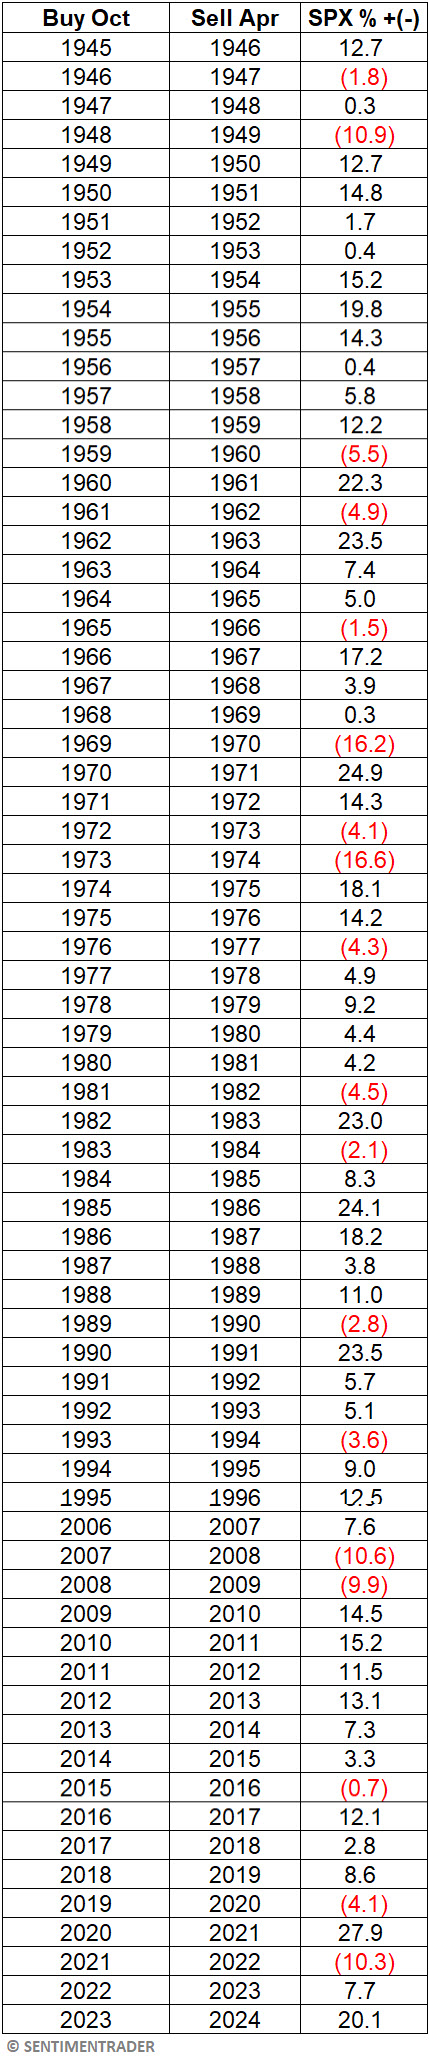
The table below summarizes performance in the table above.
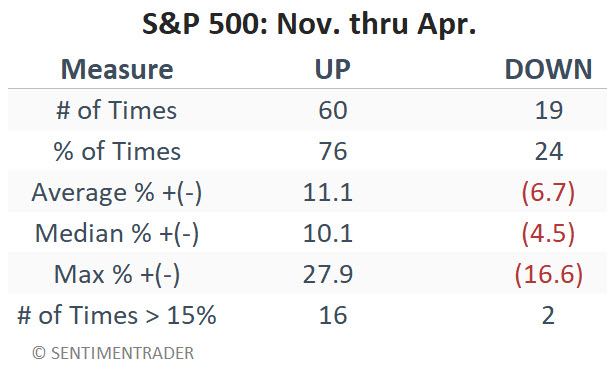
A "quick-and-dirty" analysis might label this performance as "Very good, but far from perfect." Key things to note are the 76% Win Rate, the 10.1% Median Return, and the lopsided 16 to 2 skew in periods showing a gain or loss of 15% or more.
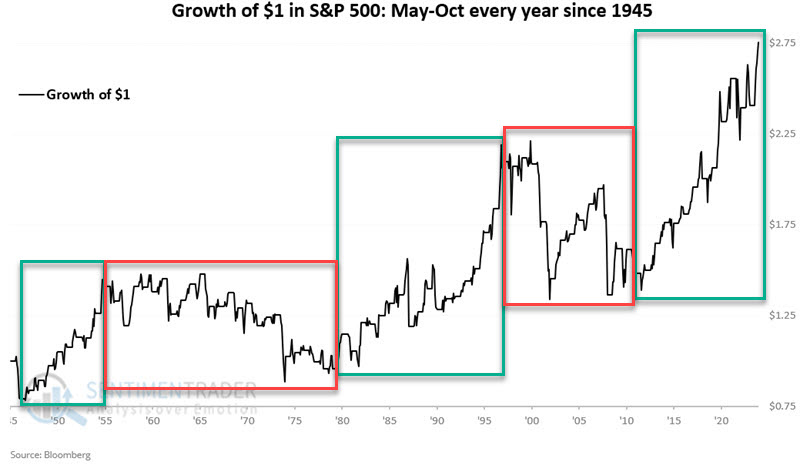
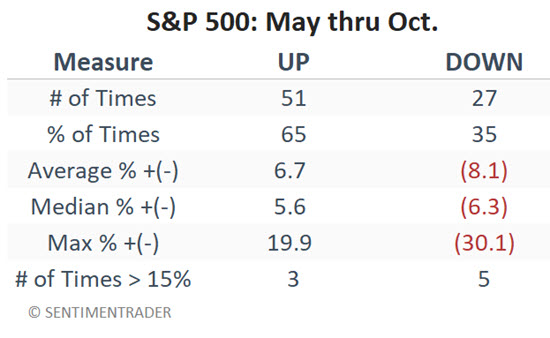
However, to fully appreciate the results above, we must compare it to the "other" six months - May through October. The chart below displays the hypothetical growth of $1 in the S&P 500 only from the end of April through the end of October every year starting in 1946. Whereas $1 invested only in Nov-May grew to more than $125, $1 invested only during the other six months grew to just $2.75. Note the inconsistent nature of returns in the chart below and the fact that May-Oct has shown a gain in ten of the last twelve years.
 The table below displays forward returns for the S&P 500 during ALL years if bought at the close on the last trading day of April and held through the following October.
The table below summarizes performance in the table above.
Comparing the two annual six-month periods head-to-head
The tables below compare the results for November through April versus May through October, looking back over the previous twelve months at the end of October each year since the end of WWII.
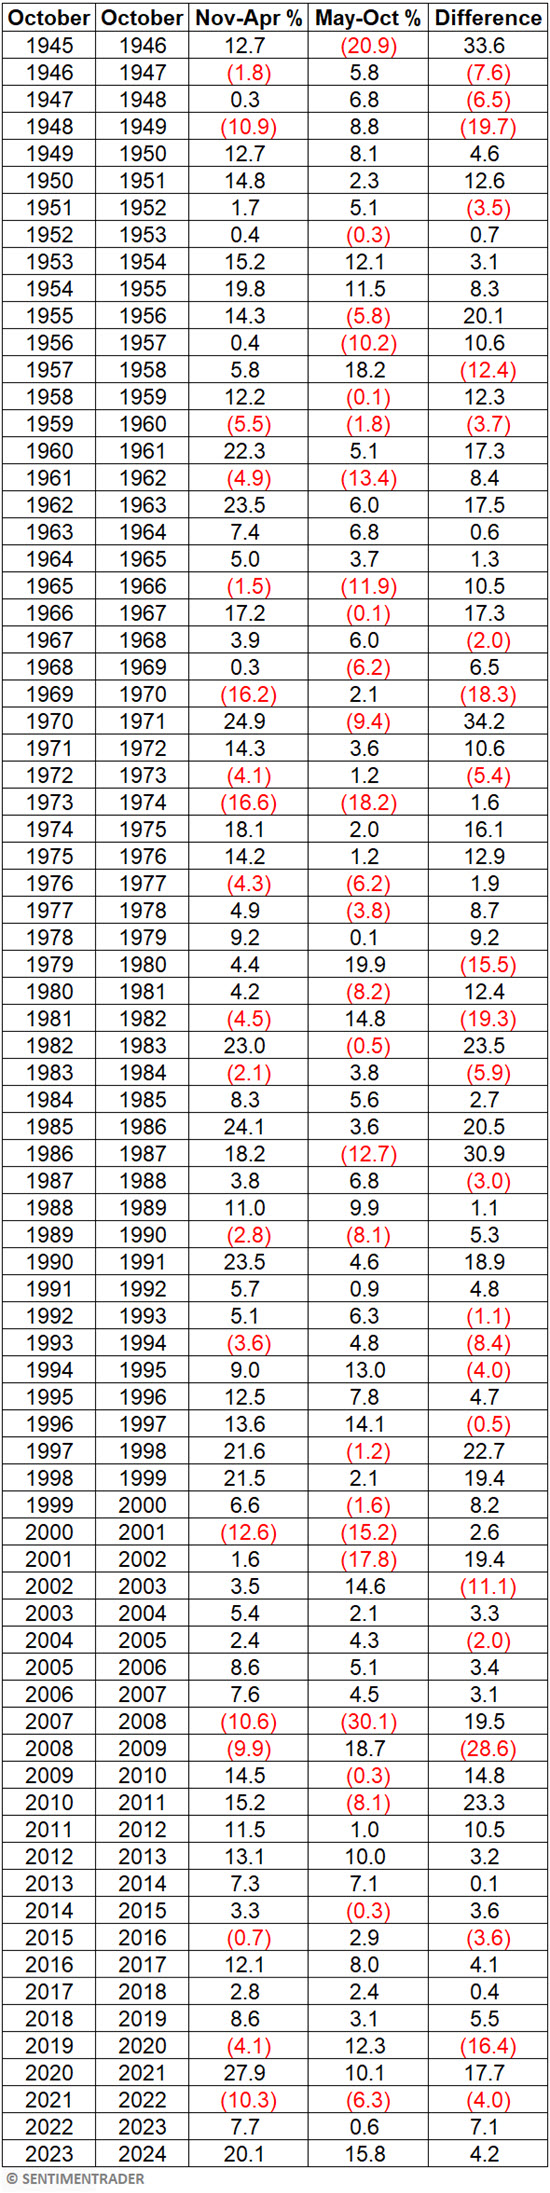
The table below summarizes S&P 500 performance for all November through April periods versus all May through October periods.
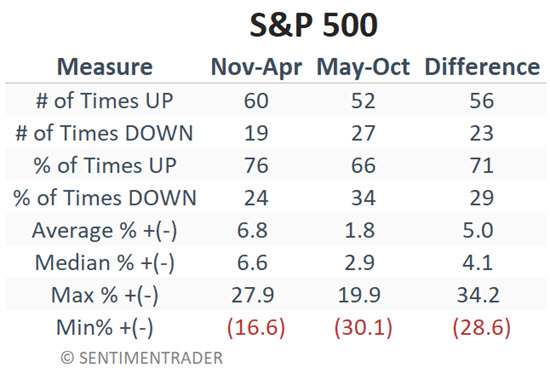
Some key things to note:
- It is incorrect to categorize Nov-April as "bullish" and May-Oct as "bearish"
- It IS more accurate to state that Nov-Apr is much more consistently favorable than May-Oct (Nov-Apr up 76% of the time versus only 66% for May-Oct, Median Gain of +6.6% for Nov-Apr versus +2.9% of May-Oct, and Nov-Apr outperformed May-Oct 71% of the time)
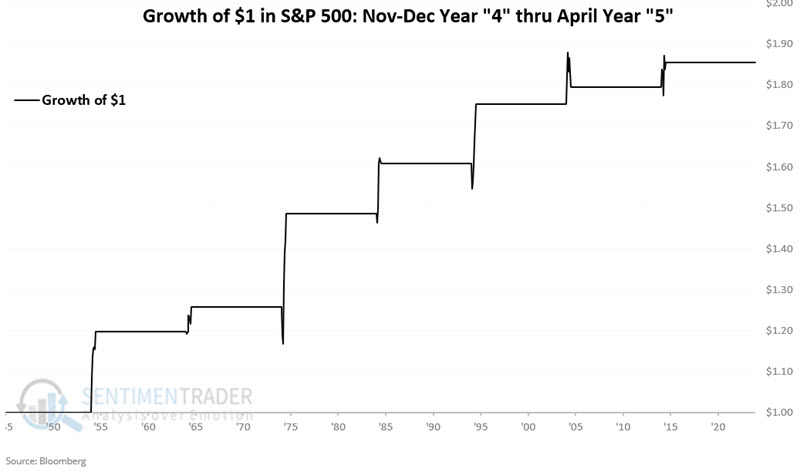
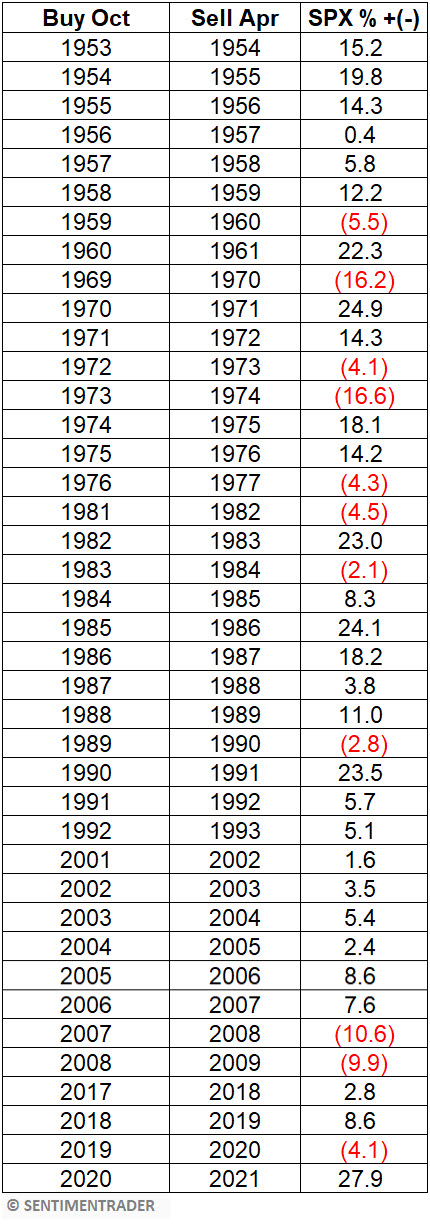
A closer look at years ending in "4"
Since this is 2024, let's look at the results if we bought the S&P 500 at the end of October only during years ending in "4" (1954, 1964, etc.).
The chart below displays the hypothetical growth of $1 in the S&P 500 only during November through April every year starting in 1945. $1 grew to $1.86
The table below displays year-by-year results.
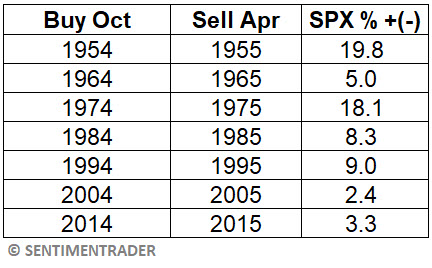
The table summarizes the S&P 500 performance shown in the table above.
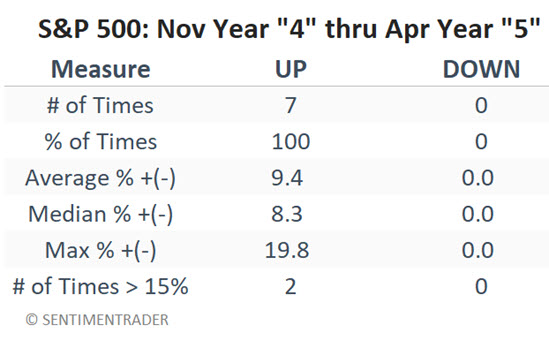
If history proves to be an accurate guide, this should be considered a favorable sign for the next six months.
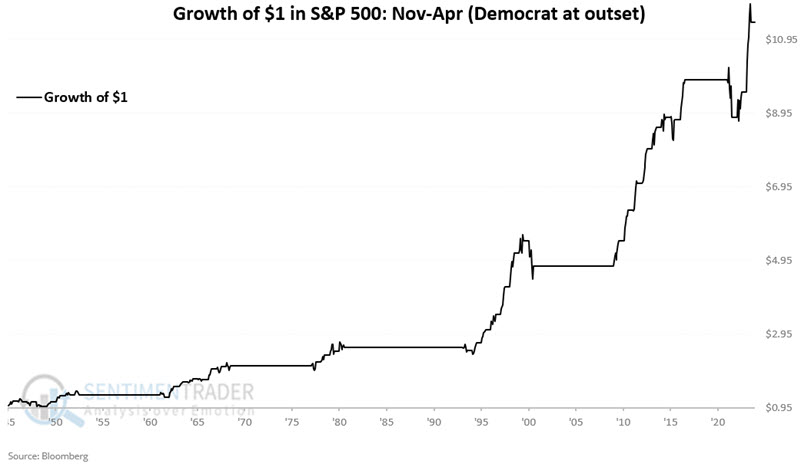
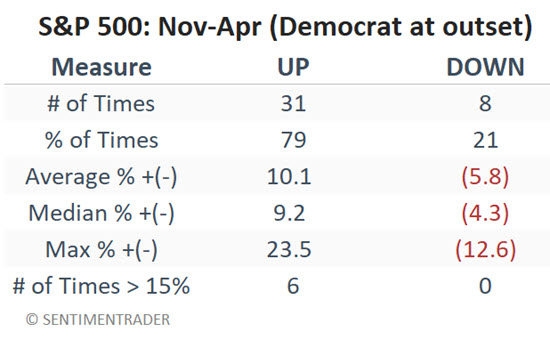
October through April with a Democrat president in office at the outset
For this test, we will look only at November through April periods that began with a Democratic president in office. This includes years when a new Republican president may have taken office the following January. The chart below displays the hypothetical growth of $1 in the S&P 500 only during November through April if a Democrat president was in office on October 31st. $1 grew to $11.43.
The table below displays year-by-year results.
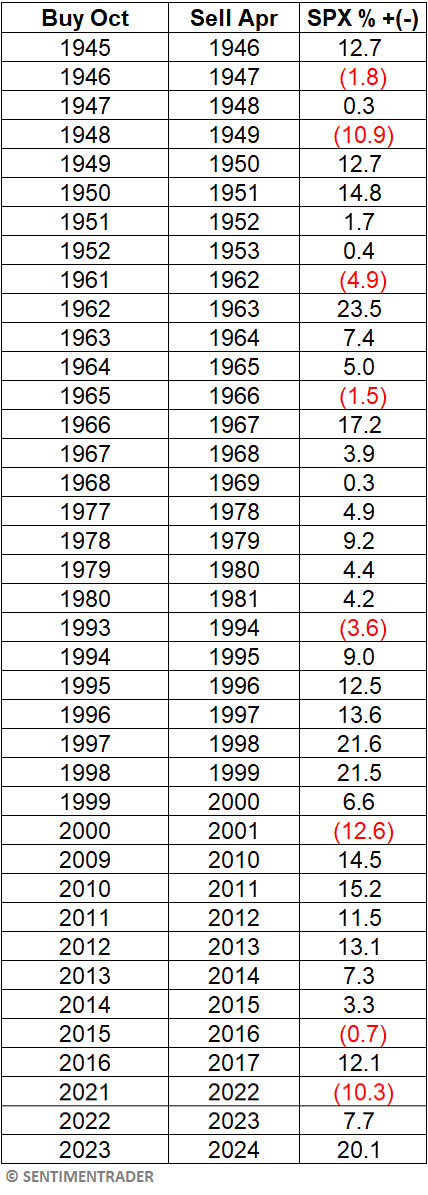
The table summarizes the S&P 500 performance shown in the table above.
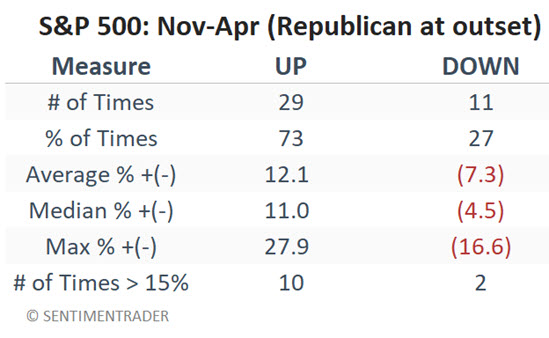
October through April with a Republican president in office at the outset
For this test, we will look only at the November through April periods that began with a Republican president in office. This includes years when a new Democratic president may have taken office the following January. The chart below displays the hypothetical growth of $1 in the S&P 500 only during November through April if a Democrat president was in office on October 31st. $1 grew to $10.99.
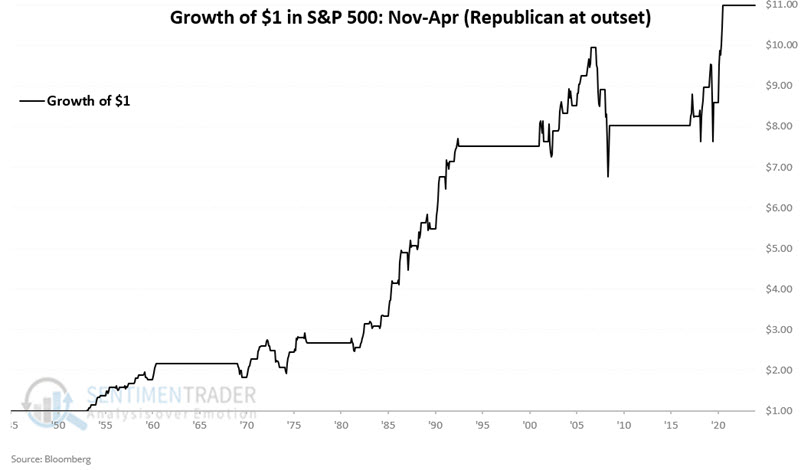
The table below displays year-by-year results.
The table below summarizes the S&P 500 performance shown in the table above.
Focusing on Presidential Election years
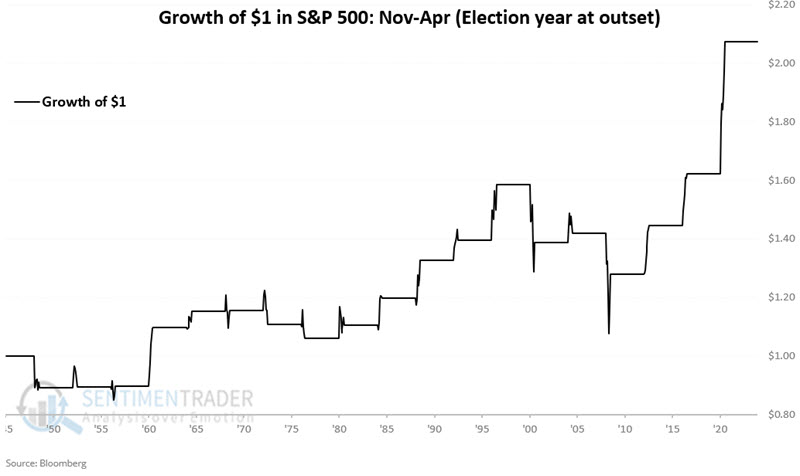
Now let's look solely at the Presidential Election years. The chart below displays the hypothetical growth of $1 in the S&P 500 only during November through April if November involves a U.S. presidential election. $1 grew to $2.07.
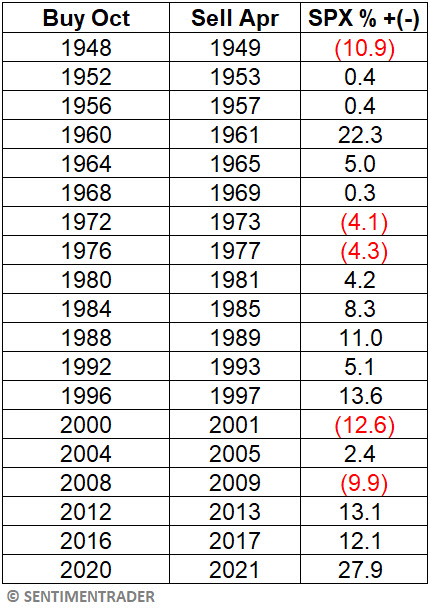
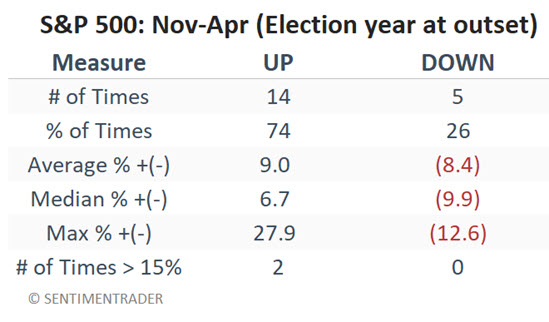
The table below displays year-by-year performance for November through April only when a U.S. presidential election occurs in November.
The table summarizes the S&P 500 performance shown in the table above. Note a slightly lower Win Rate (74% versus 76% for all years) and Median Return (6.7% versus 10.1%).
Lastly, let's look only at non-U.S. presidential election years. The chart below displays the hypothetical growth of $1 in the S&P 500 only during November through April if November does not involve a U.S. presidential election. $1 grew to $60.55.
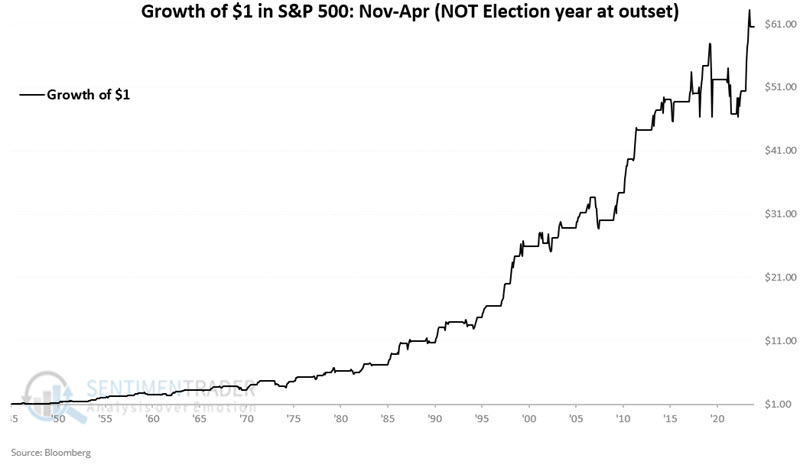
The table below displays year-by-year performance for November through April only when a U.S. presidential election does not occur in November.
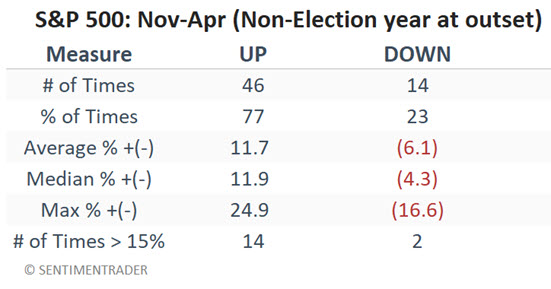
The table summarizes the S&P 500 performance shown in the table above.
What the research tells us…
So what does it all mean? The myriad of data above does not offer "absolute" conclusions or "sure things." The most favorable data point is the "Year ending in 4" phenomenon, which has seen November through April rise seven times with no declining years. Also, election years with a sitting Democrat president have performed slightly above average in terms of Win Rate (79% versus 76% for all years) but slightly below average in Median Return (9.2% versus 10.1%). There is no guarantee that stocks will show a gain in the next six months. However, the history of the next six months combined with the current established uptrend in stocks strongly suggests continuing to give the favorable case the benefit of the doubt.