
Notable Developments in Corporate Insider Activity

Key points:
- Bullish corporate insider activity is typically a favorable sign for the next one to three years
- It is especially favorable when bullish insider activity extends across an entire industry
- In recent months, insiders among Nasdaq 100 constituent stocks, and the Materials, Technology, Consumer Staples, and Healthcare sectors have been noticeably bullish in their open market buying and selling activity
A pickup in S&P 500 constituent insiders
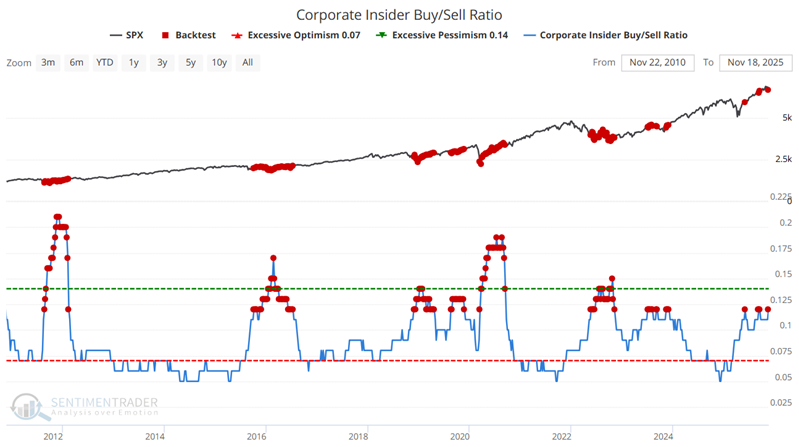
Our Corporate Insiders Buy/Sell Ratio indicator measures the buying and selling of insiders at companies that are constituent stocks of the S&P 500 index. Higher readings indicate that insiders are relatively more bullish on their own stocks, while lower readings suggest they are relatively less bullish. In the chart below, we see that the indicator value is not at a level (0.12) that we would necessarily designate as bullish. We would prefer to see a reading of 0.12 or higher.
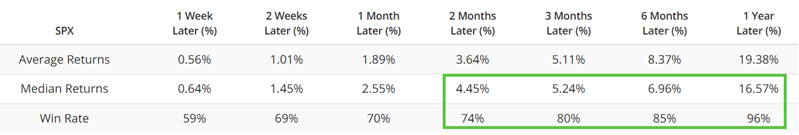
Nevertheless, it is interesting to note the difference in performance for the S&P 500 following readings from the current level, versus what we would consider to be an unfavorable reading below 0.07. The table below displays S&P 500 performance following readings above 0.12. Note the 80%+ Win Rate for 3 months and out and solid Median Returns.
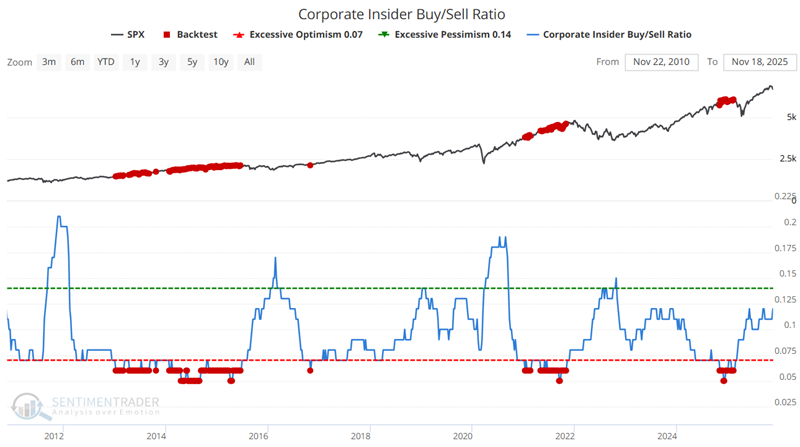
Now compare these numbers to those for indicator readings below 0.07, as shown in the table below.
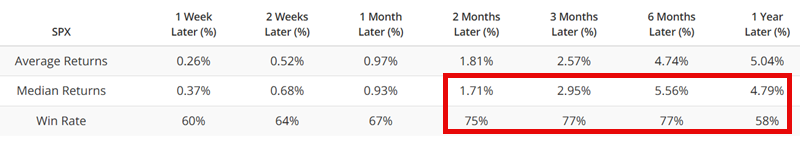
It should be noted that the results above are not intended to be interpreted as "bearish" for stocks in general. They merely point out the tendency for insider buying to be indicative of a more favorable environment for the sector or index in question.
Nasdaq 100 insiders are outright bullish
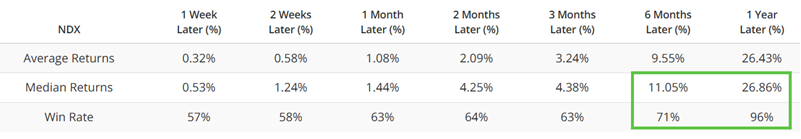
Whereas S&P 500 insiders are leaning in a favorable direction, Nasdaq 100 corporate insiders have been outright bullish of late. Following the significant run that the Nasdaq 100 has enjoyed in recent years, this likely comes as a surprise to many investors. The figures below highlight Nasdaq 100 Index performance following Corporate Insider Buy/Sell Ratio - NDX readings of .07 and higher.
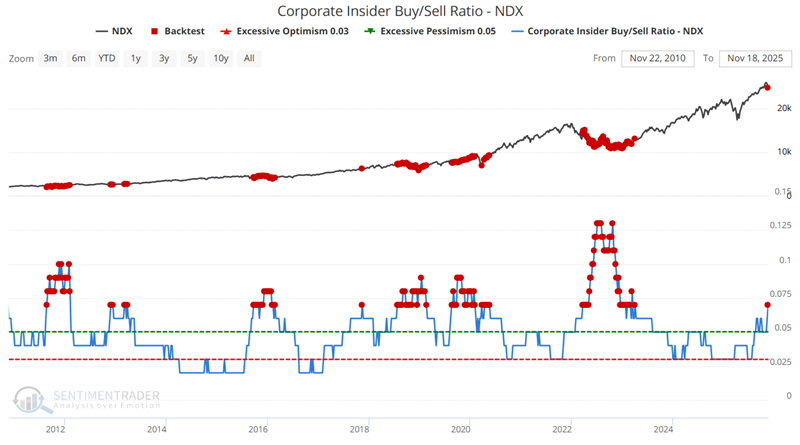
The most recent signal occurred this week. Note that initial signals can often prove "early" and that the index may sometimes trend sideways to lower for a while before moving to the upside. It is also common for insider accumulation to occur over several weeks or months.
Four sectors have seen favorable insider action lately. Let's take a closer look at those one at a time.
Sector #1: Materials
The chart below highlights those weeks when the Corporate Insider Buy/Sell Ratio - XLB was above 0.37. This occurred recently throughout September and October.
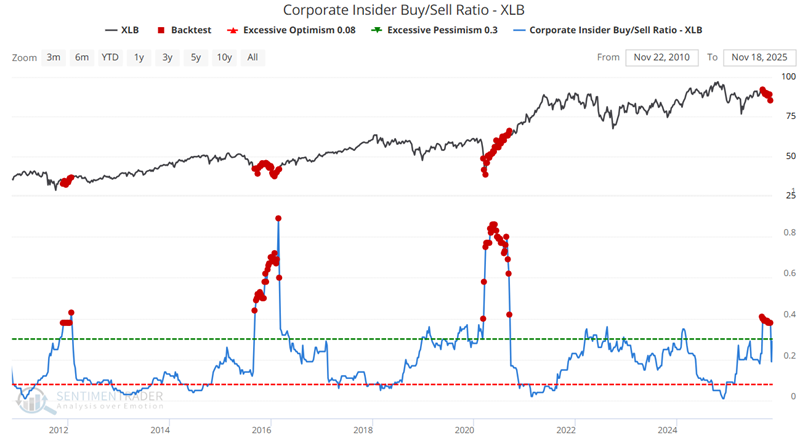
The table below summarizes subsequent action for the Materials Select Sector SPDR Fund ETF (XLB).
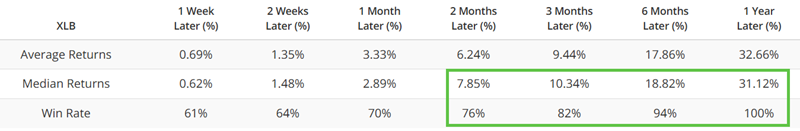
Note that XLB is currently more than 7% below its level when insider buying activity began in September. If XLB can stabilize here, longer-term investors should likely view it as a significant buying opportunity.
Sector #2: Technology
There is more than a bit of chatter about how far the technology sector has rallied and how it may be overvalued. And perhaps that will prove to be true. However, corporate insiders in the industry do not share that outlook at all. In fact, tech insiders continued to buy throughout June through September, even as the Technology Select Sector SPDR Fund ETF (XLK) rallied 20%. Buying has picked up again during the latest week.
The chart below highlights those weeks when the Corporate Insider Buy/Sell Ratio - XLK was above 0.049.
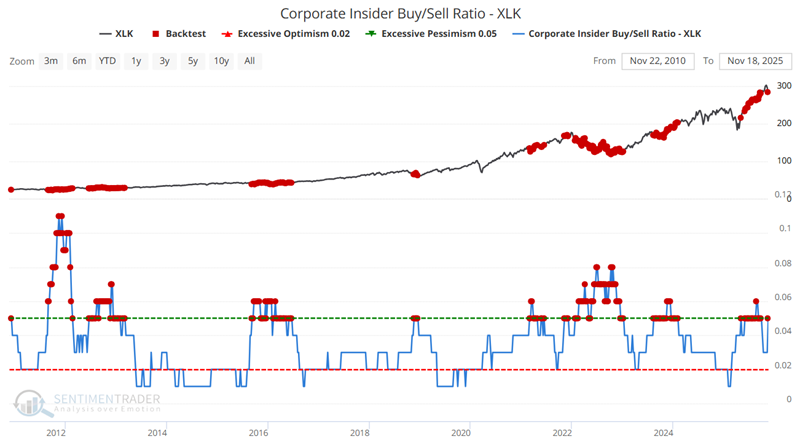
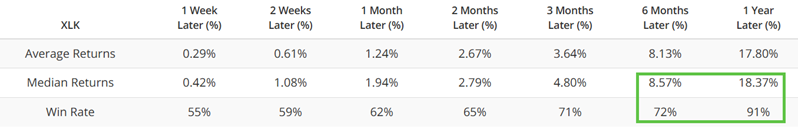
The table below summarizes subsequent action for the Technology Select Sector SPDR Fund ETF (XLK).
Tech insiders clearly have not gotten the memo that the technology sector is experiencing a "bubble." Could they end up being wrong? Of course. But history suggests otherwise.
Sector #3: Consumer Staples
The chart below highlights those weeks when the Corporate Insider Buy/Sell Ratio - XLP was above 0.15. Buying picked up recently in late October.
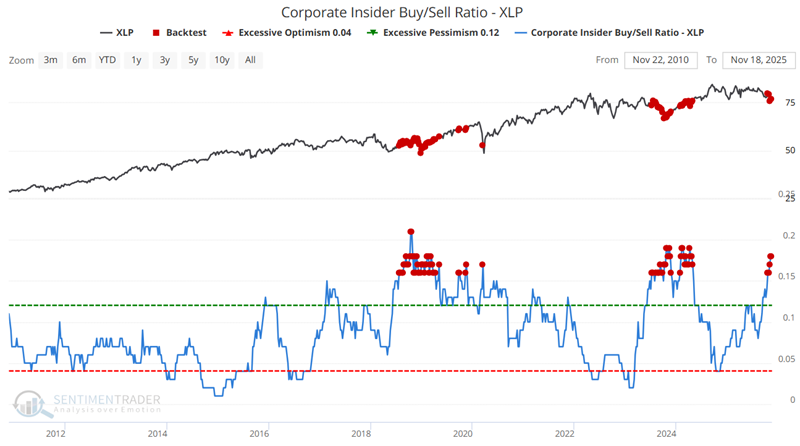
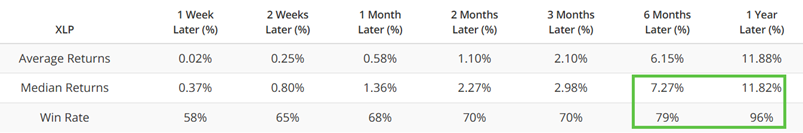
The table below summarizes subsequent action for the Consumer Staples Select Sector SPDR Fund ETF (XLP).
Investors who typically seek lower-volatility vehicles may want to take a closer look at Consumer Staples in the year ahead.
Sector #4: Healthcare
No sector is getting more love from insiders than the Healthcare sector. As shown in the chart below, favorable insider activity in the Healthcare sector increased significantly in June. It continued to accelerate into October, although it has backed off only modestly. We can't tell you specifically what Healthcare executives are seeing, but their open market activities clearly suggest that they see their industry as undervalued.
The chart below highlights those weeks when the Corporate Insider Buy/Sell Ratio - XLY was above 0.13.
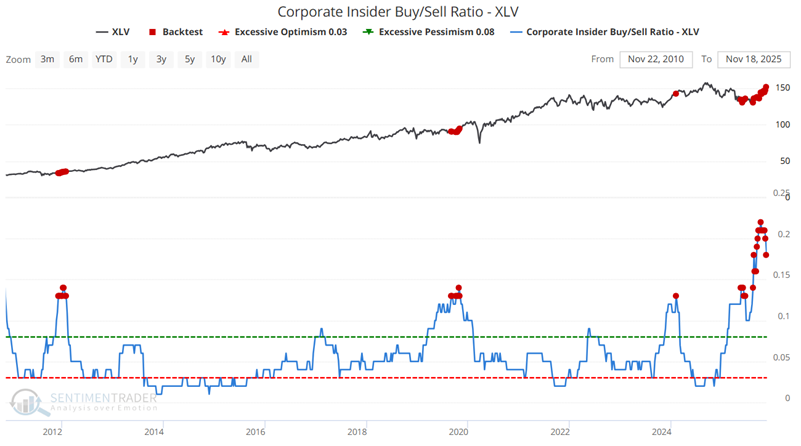
The table below summarizes subsequent action for the Consumer Staples Select Healthcare SPDR Fund ETF (XLV).
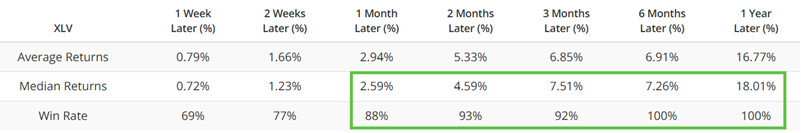
If insider activity is any indication, we expect Healthcare to be an outperformer over the next one to three years.
What the research tells us…
Insider activity indicators should not be thought of as "trading systems" that generate specific buy and sell timing signals. Instead, they serve as important "weight of the evidence" and alert us to situations where the people who know their company and industry best are seeing exceptional value. There are many reasons why corporate insiders might sell shares (cashing in, buying a house, a boat, a car, paying for college, etc.). But there is only one reason they would commit cash to purchase shares in the open market to the extent shown in the indicators above. That reason is because they expect the share price of their company to rise, typically based on the expectation for corporate earnings growth.
There has been much worrisome chatter online lately speculating on "How soon this bull market will end?" The insiders in the industries highlighted above do not appear to share those concerns. We expect the sectors highlighted above to perform well in both absolute and relative terms over the next several years.