Nikkei 225 McClellan Oscillator Thrust Signal

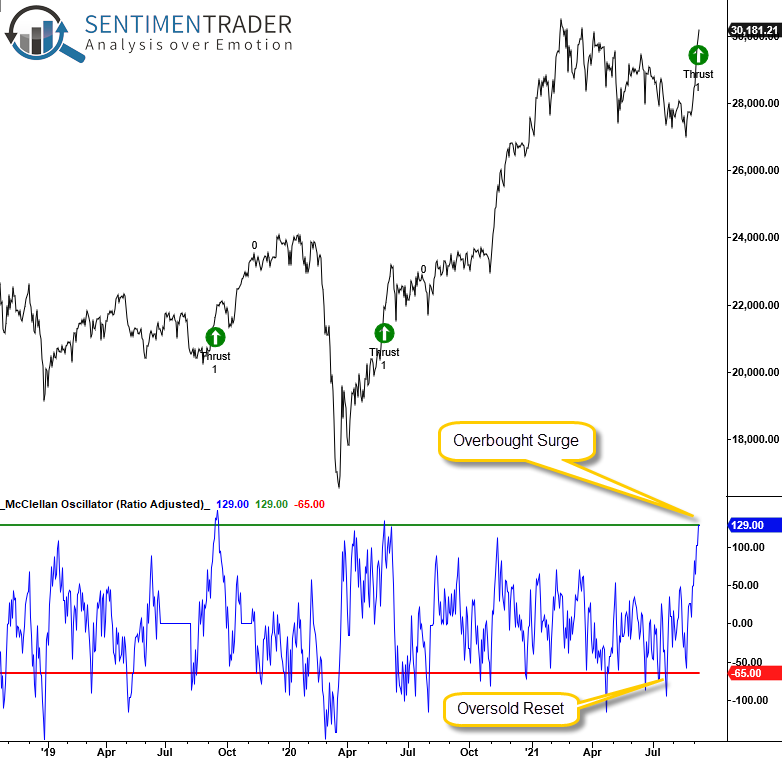
The Nikkei 225 ratio adjusted McClellan Oscillator surged to one of the highest levels in history at the close of trading on 9/7/21.
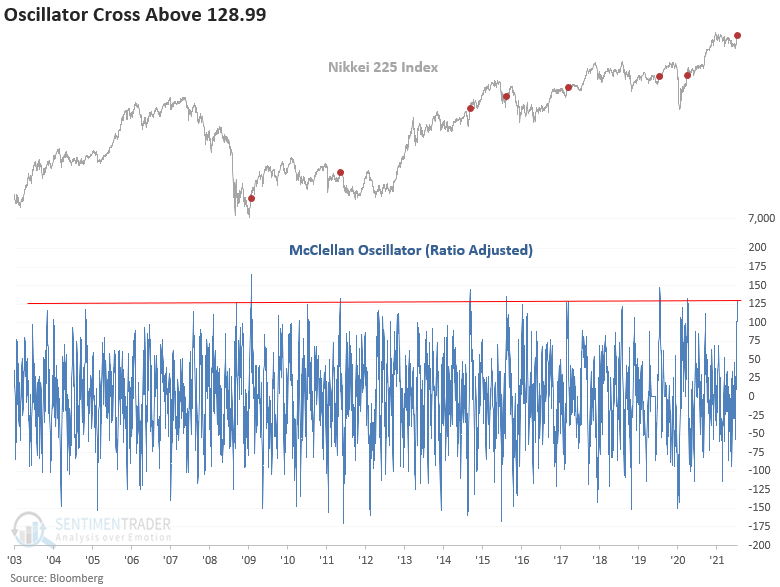
Let's conduct a study to identify when the Nikkei 225 Index ratio adjusted McClellan Oscillator crosses above 128.99 after the oscillator crosses below an oversold reset condition of -65.
CURRENT DAY CHART

HISTORICAL CHART

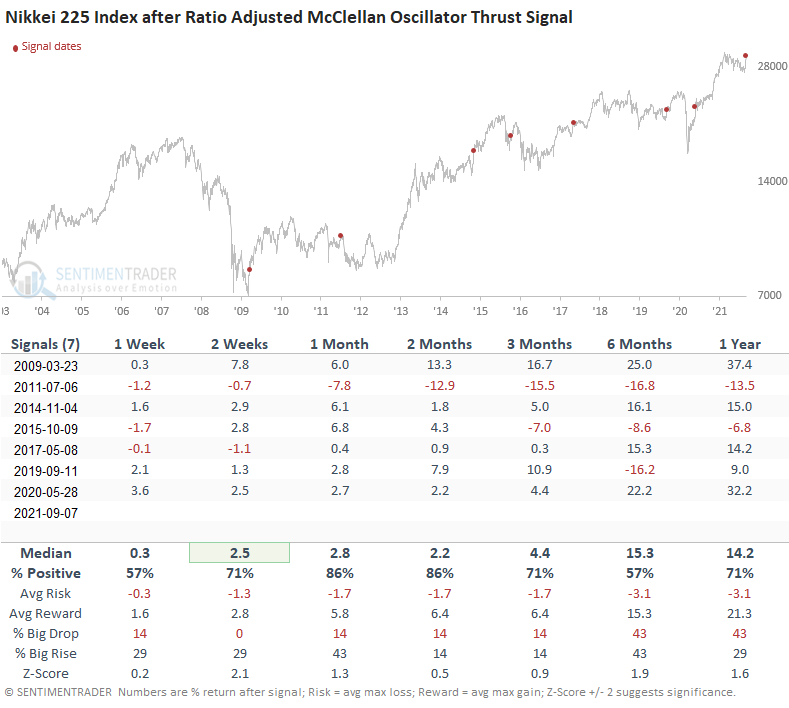
HOW THE SIGNAL PERFORMED
While the sample size is small, performance looks good, especially in the 2-week timeframe. I'm a big fan of breadth-based momentum surges as the force behind the thrust is typically enough to signal a trend change. The current momentum would suggest that the Nikkei 225 will emerge from the 6+ month consolidation with an upside breakout.

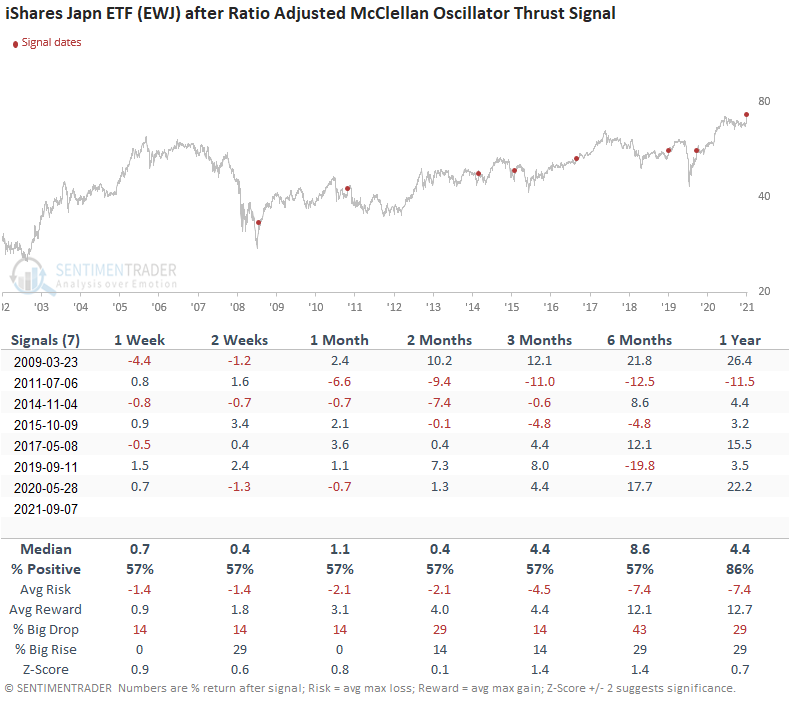
HOW THE SIGNAL PERFORMED
If we apply the same signals to the iShares Japan ETF (EWJ), we see results that look far less robust. When assessing global signals, it's always important to differentiate between the local currency and US Dollar results.


