
Nifty Buyers Turn Cautious

Key Points:
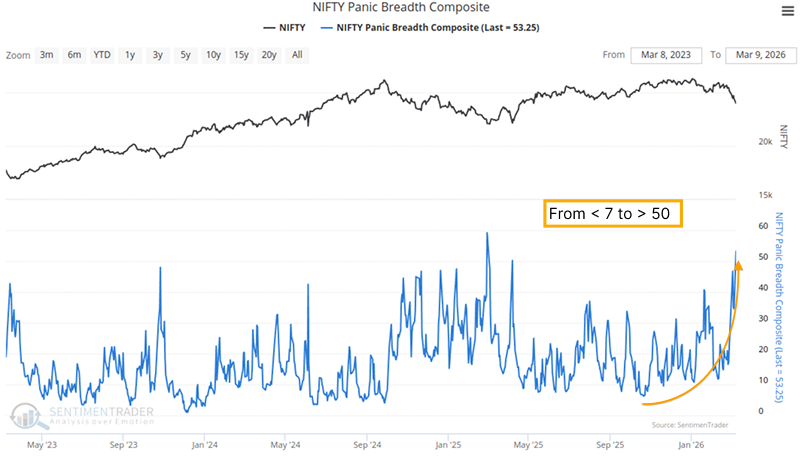
- Nifty Panic Breadth Composite surges past the 50 mark
- Resonance across breadth indicators including the McClellan Summation Index signals broad market volatility
- Historical seasonal data shows April typically delivers better performance despite current headwinds
Projected Market Outlook Post Trend Breakdown
India's equity market has faced significant pressure recently, with the Nifty 50 Index breaking below its 200-day moving average. In rigorous market analysis, a breach of long-term trendlines is rarely a mere "capital rotation" - it is a direct reflection of deteriorating macroeconomic fundamentals manifesting in price action. Against this backdrop, we observe that breadth indicators measuring internal market health have reached relatively extreme levels, reflecting aggressive defensive selling by investors amid uncertainty.
The "Rollercoaster" of Panic Indicators
One of the most striking features of recent market action is the extreme volatility in the NIFTY Panic Breadth Composite. This indicator has spiked sharply above the 50 level - a threshold that typically marks a "selling climax" in market sentiment. We analyze the indicator's trajectory by tracking its cyclical movements between key thresholds: after falling to a low of 7, the index has surged dramatically to current levels.
Reviewing data since 2003, this extreme signal has occurred only 14 times in conjunction with a break below the 200-day moving average - an extremely small statistical sample. We must exercise statistical caution when interpreting this signal.Related Backtest Click Here.
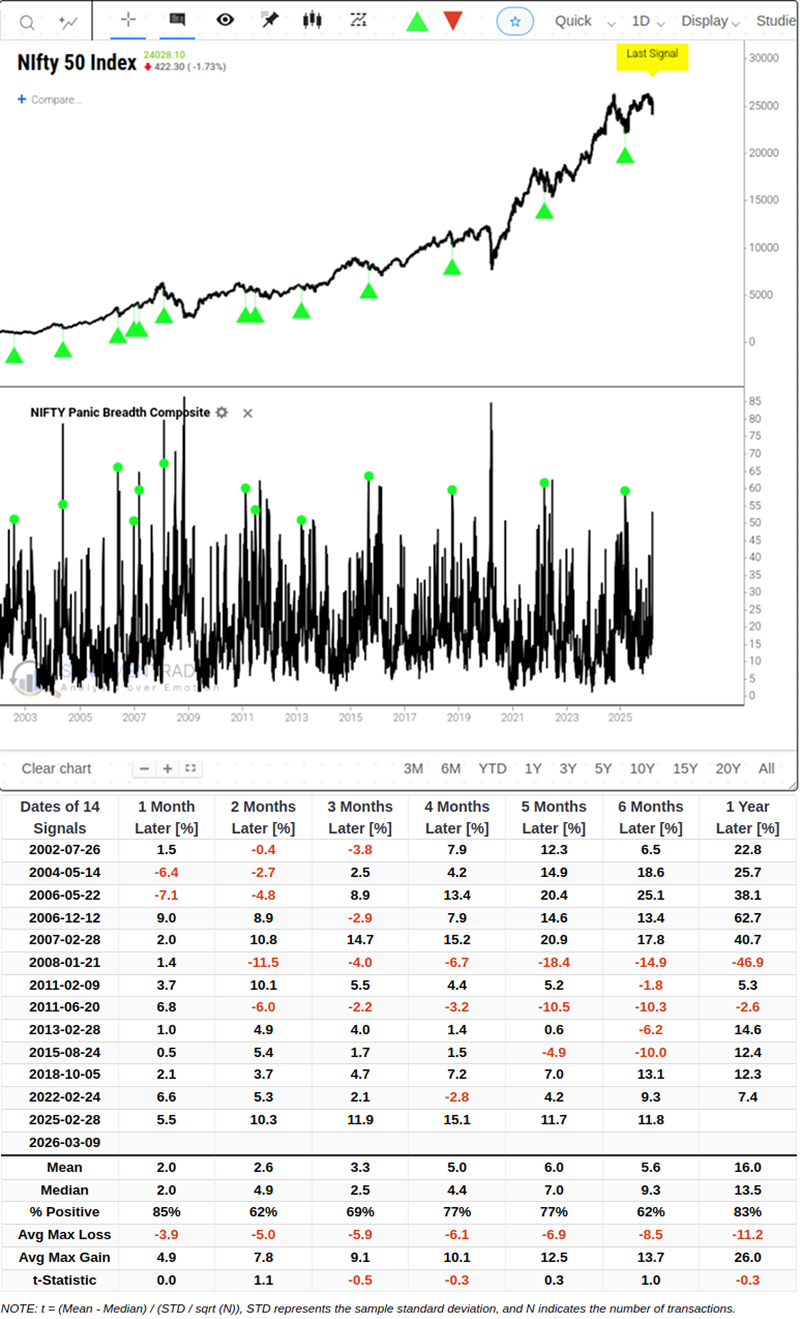
While charts show an 85% probability of positive returns for the Nifty Index in the first month following signal triggers, we cannot overlook the asymmetric risks. Data reveals average maximum drawdowns of -5.0% to -5.9% over the subsequent 2-3 months, with even deeper declines in individual extreme cases.
Independent Confirmation from Breadth Indicators
Beyond sentiment-driven panic, two independent long-term breadth indicators confirm the current weak market structure from different dimensions:
First, the NIFTY McClellan Summation Index recently broke below the critical 1000-point level. This independent signal has occurred 27 times over the past two decades when the index was below its 200-day moving average.Related Backtest Click Here.
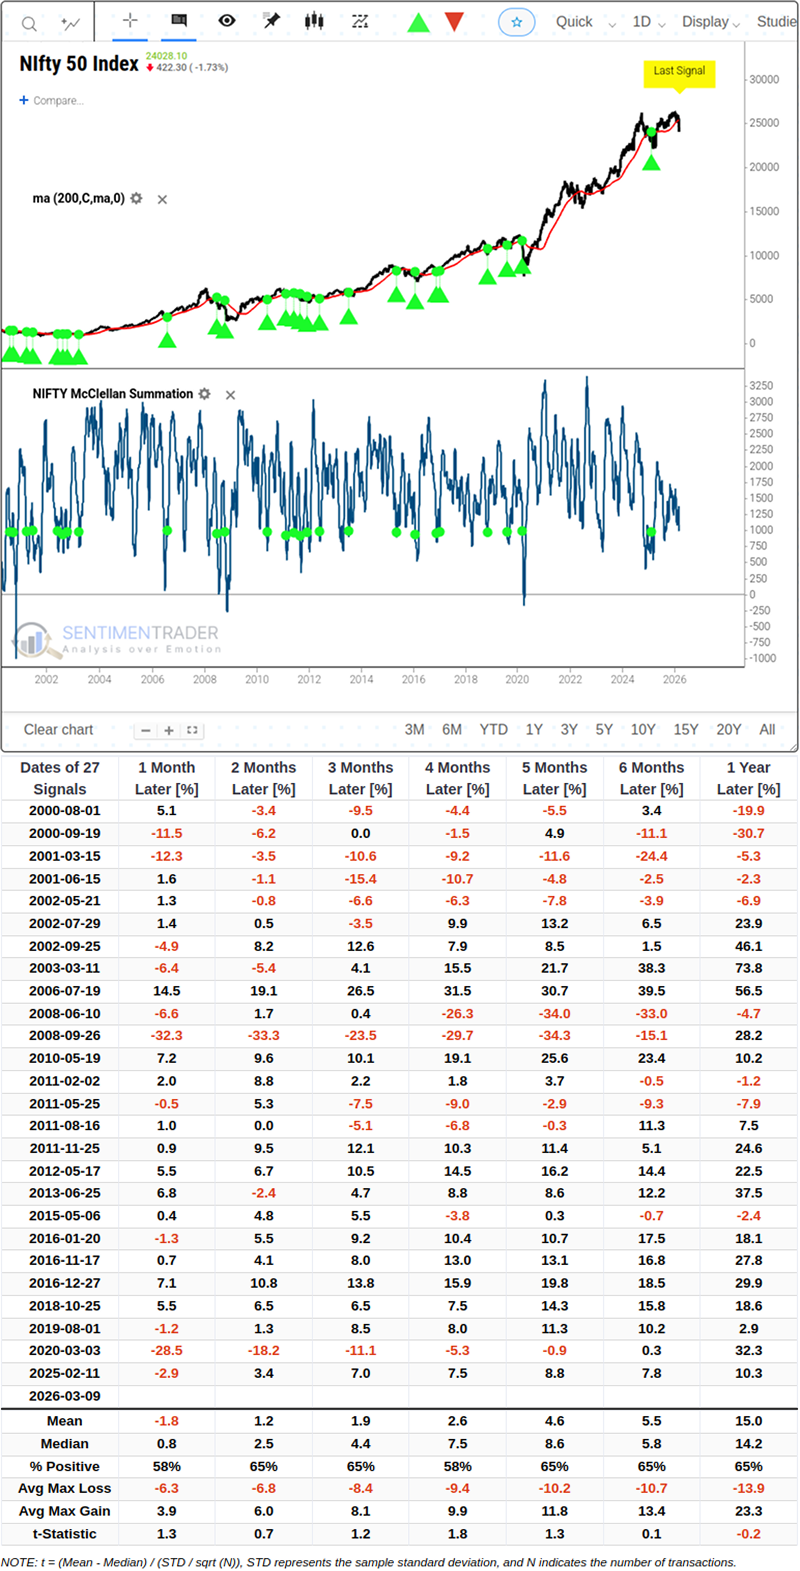
In the month following signal triggers, the market delivered an average return of -1.8% with a win rate of only 58%. This demonstrates that after breaking long-term support, downward trend inertia typically overwhelms mean reversion forces in the initial phase.
Second, the 20-period moving average of the NIFTY Advance/Decline Line has independently broken below the -5 threshold. This signal has a relatively larger historical sample size under the same moving average breakdown context.
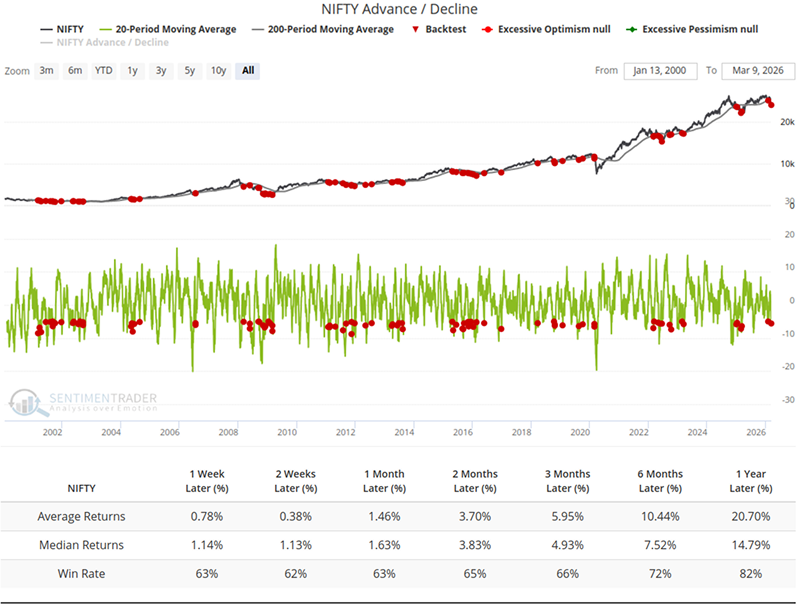
While performance remains volatile in the first 1-2 weeks, win rates steadily rise to 72% and above at the 6-month and 1-year horizons.
These two independent signals indicate the market is in a complex bottom-building phase requiring extended time to digest resistance and clear positions - not the starting point of an immediate V-shaped reversal.
Seasonal patterns provide additional context when evaluating these indicators:
From a long-term perspective, March has historically been a weak month for the Nifty Index, with a win rate below 50% and only marginally positive average returns.
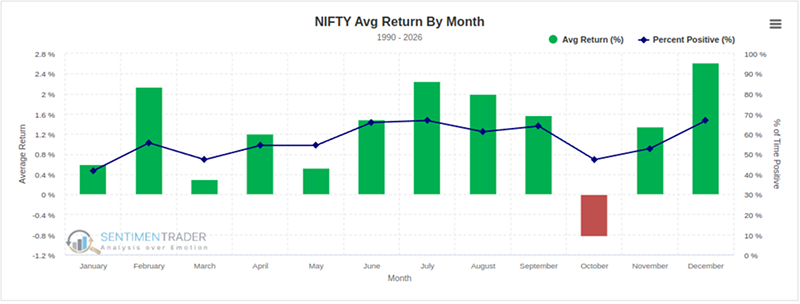
Shifting to a 20-year perspective, we see improved March performance, while April maintains extremely high win rates and significantly positive average returns.
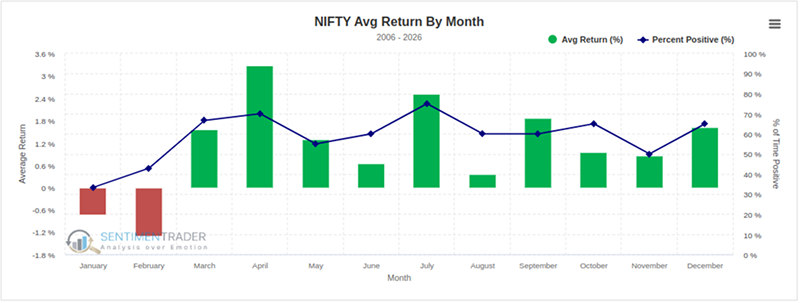
Across both long-term and 20-year datasets, March typically brings lackluster performance and increased volatility for the Nifty Index, while April has historically shown a high probability of positive returns.
What the Research Tells Us...
India's equity market was once a favored safe haven for global capital until geopolitical uncertainties and energy inflation pressures refocused investor attention on risk defense. Unlike healthy pullbacks in previous bull markets, this long-term moving average breakdown fundamentally reflects a substantive reassessment of macroeconomic fundamentals - not just transient sentiment fluctuations. Historically, while bargain-hunting buyers will likely attempt a short-term technical rebound following extreme panic signals, such rebounds are often accompanied by painful drawdown tests.