Products
SentimenTrader Trading Tools
‍
Backtest Engine
My Trading Toolkit
Correlation Analysis
Seasonality
Indicators & Data API
‍
Proprietary Indicators & Charts
Market Data API
Strategies & Scanner
‍
50+ Trading Strategies
Smart Stock Scanner
Research Reports
‍
Research Solutions
Reports Library
Free Resources
Simple Backtest Calculator
Simple Seasonality Calculator
The Kelly Criterion Calculator
Sentiment Geo Map
Public Research Reports
Pricing
Company
About
In the News
Testimonials
Client Success Stories
Contact
Log inLoginSign up
< BACK TO ALL REPORTS

Newly positive economic surprises suggest higher stock prices

Dean Christians
2021-11-11
Economic surprises in the U.S. have turned positive for the first time since July. This triggered a signal with a 91% win rate for the S&P 500 over the next year.

Key points:

  • The Citigroup economic surprise index has turned positive
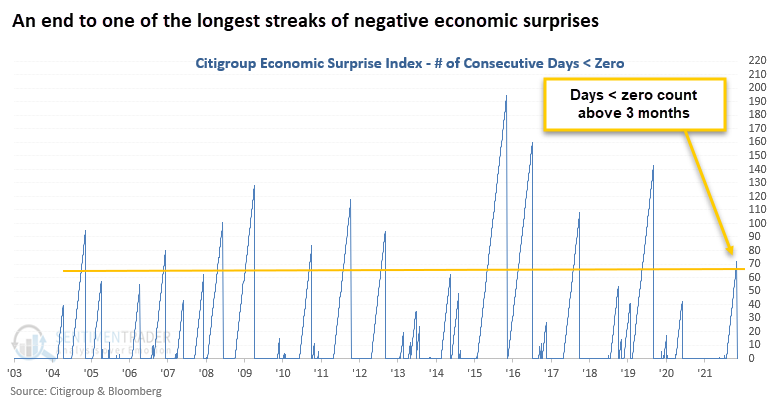
  • The change ends a streak of 72 days in negative territory
  • Similar crosses above zero have led to solid 1-year forward returns

Using economic surprises as a stock market signal

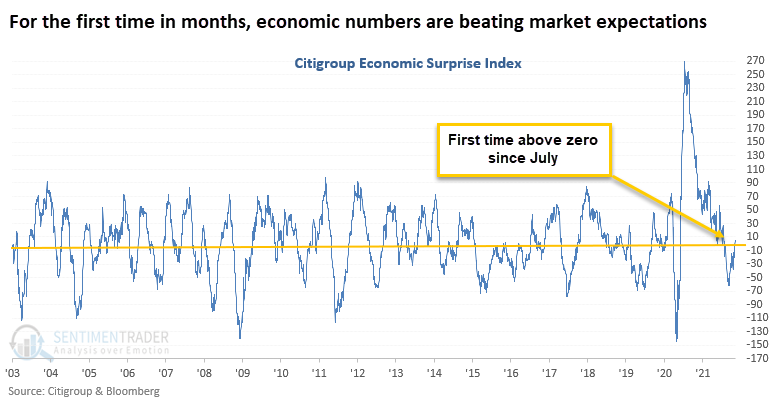
According to Bloomberg, the Citigroup economic surprise index measures data surprises relative to market expectations. A positive reading means that data releases have been stronger than expected and a negative reading means that data releases have been worse than expected.

After a surge in positive economic reports a year ago, economists adjusted their expectations and subsequent reports failed to meet those higher standards. Now that conditions are (somewhat) normalizing, reports are once again beating economists' expectations.

In recent days, the Citigroup economic surprise index crossed above zero.

This move into positive territory ended a streak of more than 70 days below zero. That was one of the longer streaks of negative surprises since 2003.

Reversals in the Economic Surprise Index preceded gains 91% of the time

This signal has triggered 11 other times over the past 18 years. After the others, future returns were positive across all time frames.  A year later, the S&P 500 was higher 91% of the time, with one untimely signal during the financial crisis.

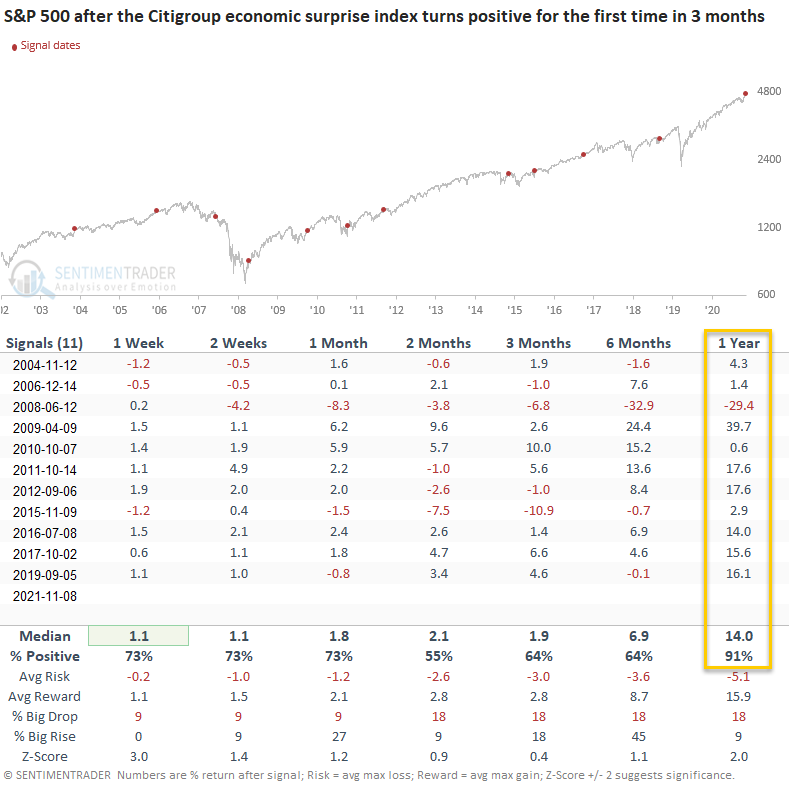
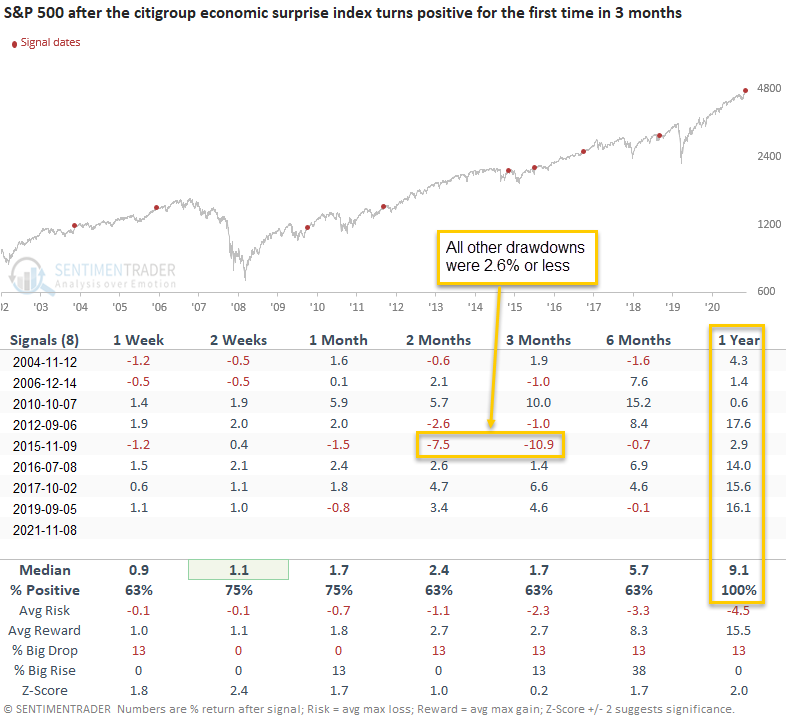
If we add a filter for when the S&P 500 is trading above its 200-day moving average, as is the case now, the S&P was higher 100% of the time over the next year.

Why bond yields may rise

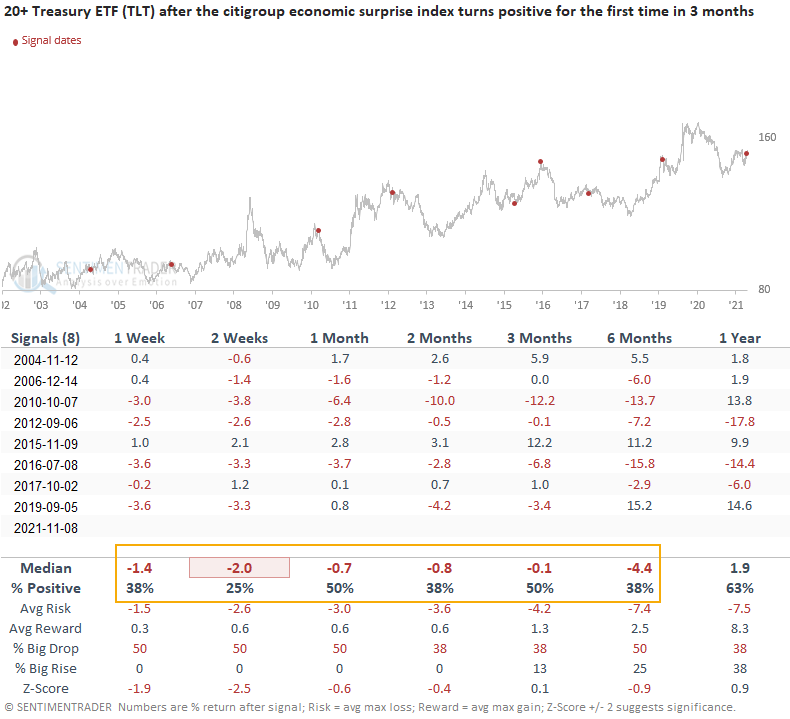
Looking at those same signal dates, but for returns in the TLT fund, returns were weak. Over the next couple of weeks, TLT declined after 6 out of the 8 signals, and it showed a negative average return across all time frames up to 6 months later.

What the research tells us...

When the Citigroup economic surprise index reverses from an extended period of worse than expected data to a period of better than expected data, stocks and bond yields have tended to rise. 

Sorry, you don't have access to this report

Upgrade your subscription plan to get access
Go to Dasboard
PRODUCTS
SentimenTrader
Trading Tools
Indicators & Data API
‍
Strategies & Scanner
‍
Research Reports
FREE
RESOUrCES
Simple Backtest
Calculator
Simple Seasonality
Calculator
The Kelly Criterion
Calculator
Sentiment Geo Map
‍
Public Research Reports
‍
Pricing
Bundle pricing
‍
Announcements
‍
FAQ
COMPANY
‍
About
‍
In the News
‍
Testimonials
‍
Client Success Stories
CONTACT
‍
General Inquiries
‍
Media Inquiries
‍
Financial Professionals Inquiries
‍
© 2025 Sundial Capital Research Inc. All rights reserved.
Setsail Marketing
TermsPrivacyAffiliate Program
Risk Disclosure: Futures and forex trading contains substantial risk and is not for every investor. An investor could potentially lose all or more than the initial investment. Risk capital is money that can be lost without jeopardizing ones’ financial security or life style. Only risk capital should be used for trading and only those with sufficient risk capital should consider trading. Past performance is not necessarily indicative of future results.

Hypothetical Performance Disclosure: Hypothetical performance results have many inherent limitations, some of which are described below. No representation is being made that any account will or is likely to achieve profits or losses similar to those shown; in fact, there are frequently sharp differences between hypothetical performance results and the actual results subsequently achieved by any particular trading program. One of the limitations of hypothetical performance results is that they are generally prepared with the benefit of hindsight. In addition, hypothetical trading does not involve financial risk, and no hypothetical trading record can completely account for the impact of financial risk of actual trading. for example, the ability to withstand losses or to adhere to a particular trading program in spite of trading losses are material points which can also adversely affect actual trading results. There are numerous other factors related to the markets in general or to the implementation of any specific trading program which cannot be fully accounted for in the preparation of hypothetical performance results and all which can adversely affect trading results.

Testimonial Disclosure: Testimonials appearing on this website may not be representative of other clients or customers and is not a guarantee of future performance or success.