
New Signals from High-Yield Bonds and Healthcare and Industrial Sector Insiders

Key points:
- Despite recent market weakness and geopolitical tensions, the major indexes continue to hold above their respective long-term moving averages. We cannot predict if, or how long, this condition will last. But as long as the trend can objectively be identified as favorable, it makes sense to look for buying opportunities
- As the character of the market changes - especially later in a bull cycle - focusing on individual sectors can be beneficial versus simply buying and holding an index fund
- Recent favorable signals have been flashed by high-yield bonds, as well as insiders in the Healthcare and Industrial sectors
A trading signal from high-yield bonds
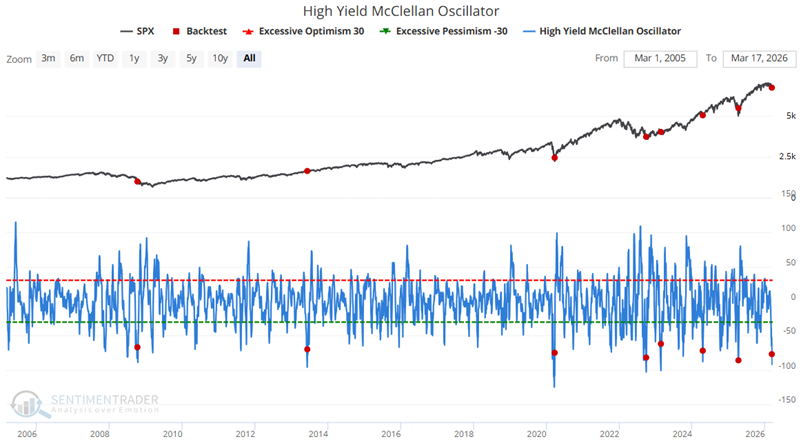
High-yield bonds have a much higher correlation to stocks than to treasury bonds. As a result, trend and overbought/oversold indicators for high-yield bonds can often flash useful signals for stock investors.
For example, the High-Yield McClellan Oscillator recently bounced off an extremely oversold level. This has historically been a favorable sign for stocks. The chart below shows all dates when the High-Yield McClellan Oscillator crossed above -88 for the first time in a month. The most recent signal occurred on March 16th.
The table below summarizes subsequent performance for the S&P 500 Index.
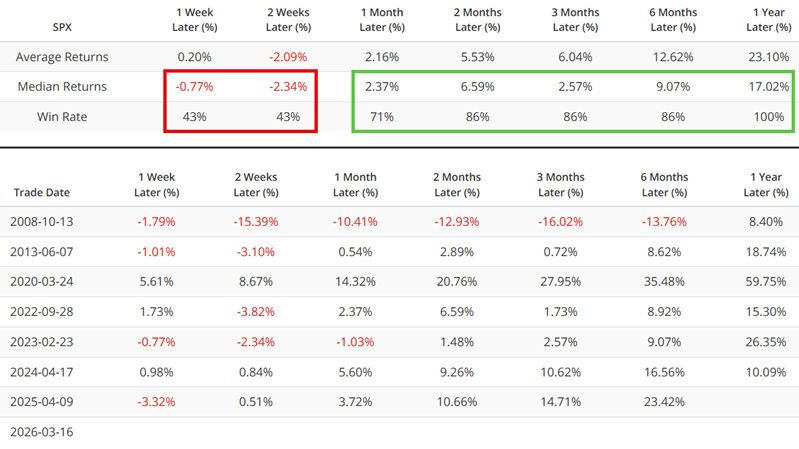
History shows that the S&P tends to show initial weakness. However, the Win Rate for 2 months to 12 months has ranged from 86% to 100%. As always, it is essential to point out that historical results in no way guarantee future performance, and indicator signals constitute "weight of the evidence" and not automatic "buy" signals.
Some favorable signals for Healthcare
The Healthcare sector has been a top performer since bottoming in August of 2025. The good news is that this sector rallied by more than 25% from August 2025 to January 2026, hitting a new all-time high in the process. The bad news is that the new high proved very fleeting, and the sector has since cooled off, recently declining almost 7% from its high. Despite this, it may remain a market leader.
In the past 13 months, sector insiders have been aggressively "loading up," aggressively buying their own shares in the open market with their own money, as reflected in the chart below.
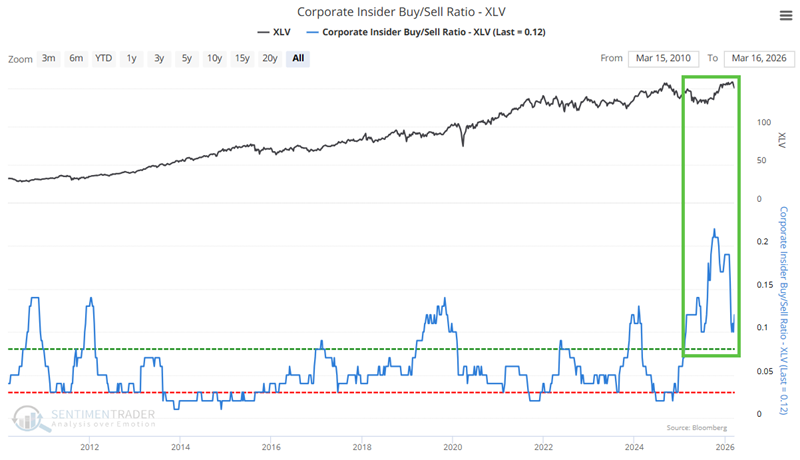
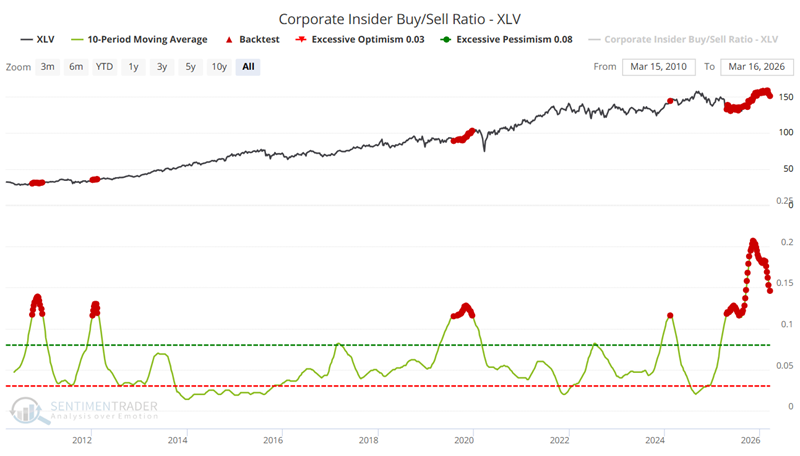
It is important to note that insiders are often early buyers. However, over holding periods of one year or more, they are rarely wrong when they act en masse. The chart below shows all weeks when the 10-week average for the Corporate Insider Buy/Sell Ratio - XLV indicator was above 0.12. What we see is the largest and longest period of insider accumulation in this sector in the last 15 years.
The table below summarizes the results.
A different look at the Healthcare sector shows that it may be bouncing off an oversold level. Historically, this too has tended to have favorable implications for the sector going forward.
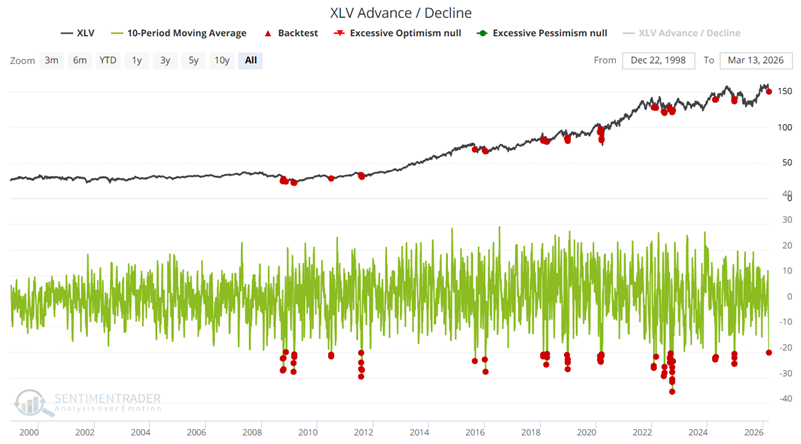
Our XLV Advance/Decline indicator shows the number of stocks in the State Street Health Care Select Sector SPDR ETF (XLV) that advanced minus declined on the day. This is a breadth figure, so we can see the participation of fund members. Oftentimes at turning points, the underlying breadth will diverge positively (at bottoms) or negatively (at tops) from the index. It is also useful to monitor extremes in the breadth figures. When so many components of an index are doing well or poorly, we usually see the index make a counter move in the days, weeks, or months following the extreme.
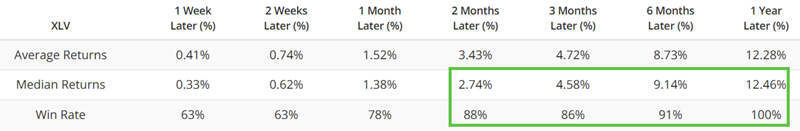
The chart below shows all dates - including overlapping signals - when the 10-day average of our XLV Advance/Decline indicator was below -20. The most recent signal occurred on March 16th.
The table below summarizes the subsequent performance for ticker XLV.
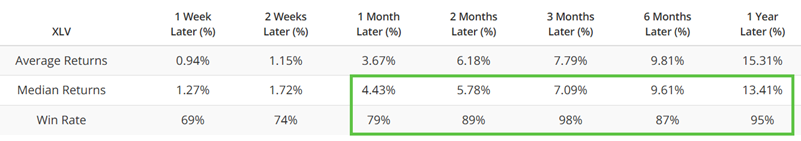
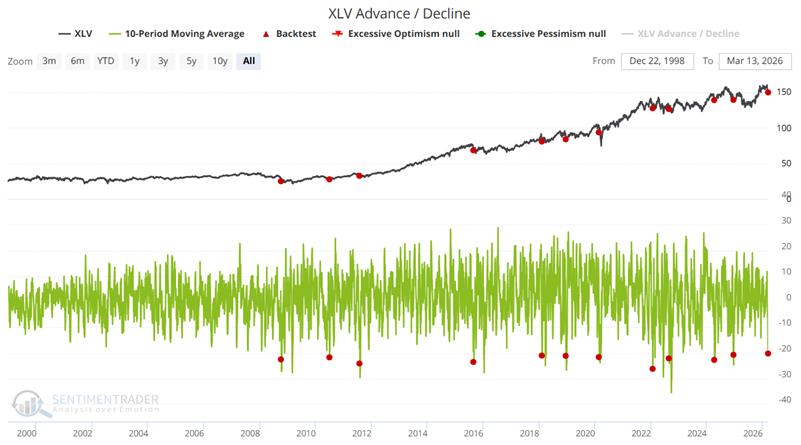
For the next test, we will remove many overlapping signals by considering only those times when the 10-day average fell below -20 for the first time in the last 6 months.
The table below summarizes the subsequent performance for ticker XLV following these signals.
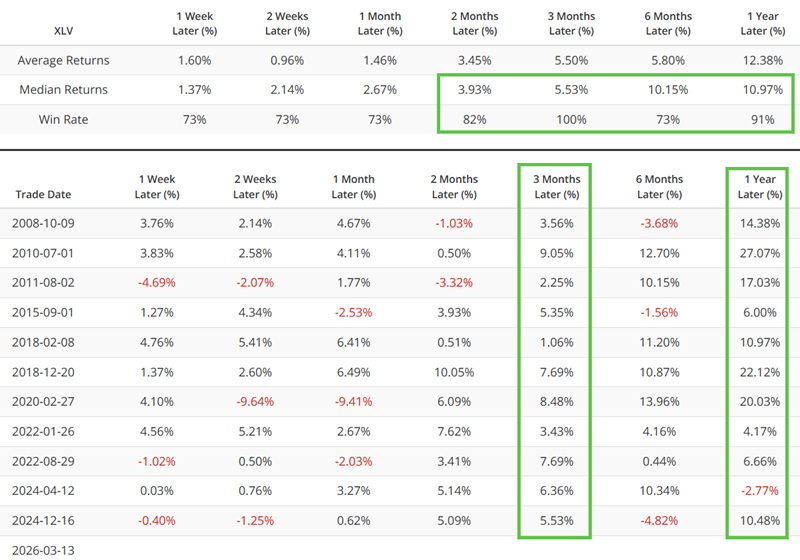
This signal does not guarantee an automatic rebound, nor a powerful subsequent rally. It does, however, lend favorable weight to the weight of the evidence ledger regarding the potential for Healthcare to perform well, both on an absolute basis and relative to the overall market.
A rare signal from Industrial sector insiders
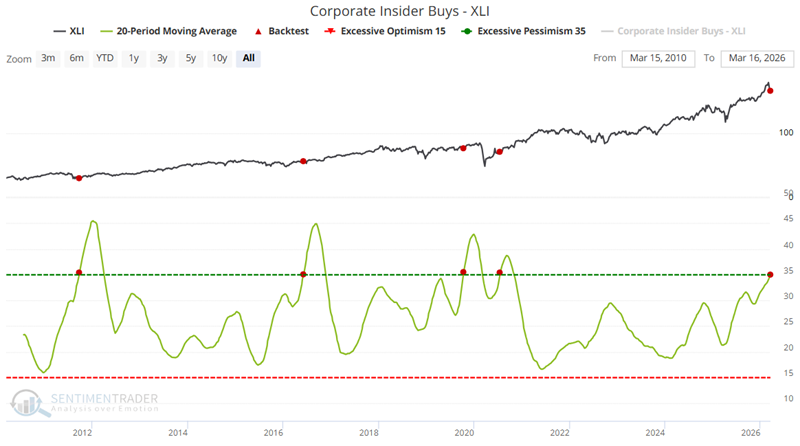
I mentioned earlier that insider buying is sometimes early. One approach to avoid over-reacting to initial insider buying is to apply a moving average. The State Street Industrial Select Sector SPDR ETF (XLI) tracks the S&P 500 Industrials Sector Index. Our Corporate Insider Buys - XLI indicator tracks the buying and selling of the corporate insiders among the component companies of that index.
The chart below shows those dates when the 20-week average of the Corporate Insider Buys - XLI indicator crossed above 34.9. This happens very infrequently and indicates that industry insiders have been net accumulating shares for months. The most recent signal just occurred on March 16th.
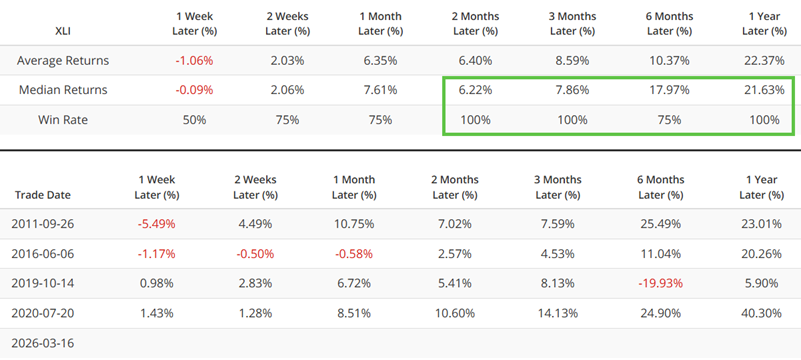
The table below summarizes subsequent XLI performance following these signals.
What the research tells us…
The character of the stock market does seem to have changed recently. There has been a rotation away from the previous leading sectors toward new ones. Breadth indicators (primarily Advance/Decline and New High/New Low numbers) have weakened. Likewise, a number of major market indexes have declined towards their respective 200-day moving averages. Add to all this the market, economic, and geopolitical uncertainty regarding conflict in the Middle East, and it is easy to be pessimistic.
However, at this point, all of the major market indices remain above their longer-term moving averages. If this changes, I will likely take some defensive action (that is personal opinion and strategy choice, NOT advice for other investors) even if it means getting whipsawed if things turn around quickly. But, as long as the major trend holds, investors may do well to ignore the fear and focus on objective signals like those detailed above.