Products
SentimenTrader Trading Tools
‍
Backtest Engine
My Trading Toolkit
Correlation Analysis
Seasonality
Indicators & Data API
‍
Proprietary Indicators & Charts
Market Data API
Strategies & Scanner
‍
50+ Trading Strategies
Smart Stock Scanner
Research Reports
‍
Research Solutions
Reports Library
Free Resources
Simple Backtest Calculator
Simple Seasonality Calculator
The Kelly Criterion Calculator
Sentiment Geo Map
Public Research Reports
Education
Sentiment Indicators
Technical Indicators
Pricing
Company
About
In the News
Testimonials
Client Success Stories
Contact
Log inLoginSign up
< BACK TO ALL REPORTS

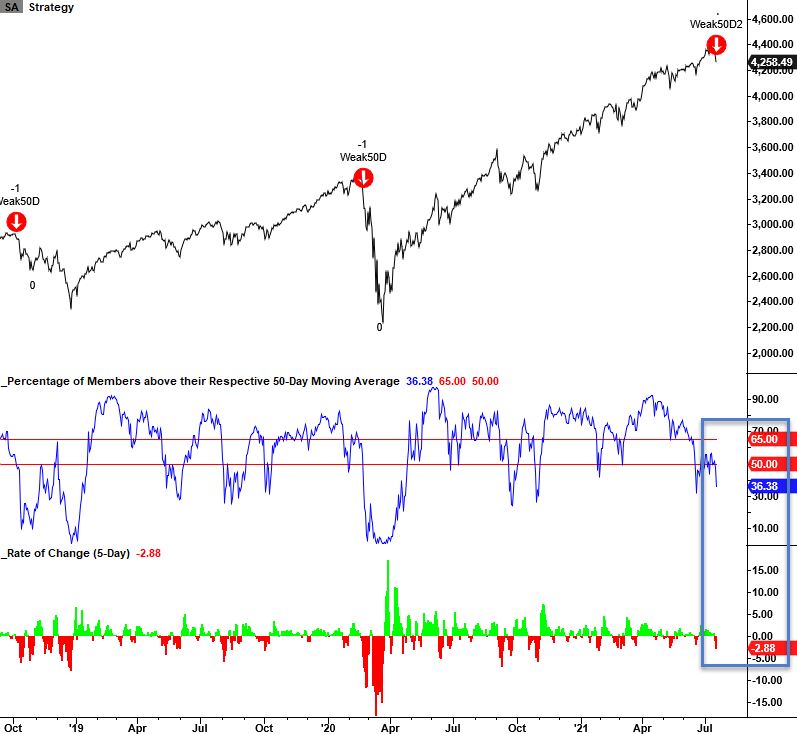
New Risk-Off Signal - Percent Above 50-Day

Dean Christians
2021-07-20
The percentage of S&P 500 members trading above their respective 50-day average registered a risk-off warning alert at the close of trading on 7/19/21. Let's review the forward return outlook for stocks.

The percentage of S&P 500 members trading above their respective 50-day average registered a risk-off warning alert at the close of trading on 7/19/21. With the new signal, the Risk-Off Composite Model count as a percentage of components increases to 40%.

For a note with more details on the percentage of members trading above the 50-day average, please click here.

For a note with more details about the Risk-Off Composite Model, please click here.

CURRENT DAY CHART

The percentage of members above the 50-day average had been deteriorating for months. However, when the indicator fell below the threshold level for a risk-off signal, price momentum for the S&P 500 was strong, and the model avoided an alert. With the sell-off in the market over the last few days, the momentum condition kicked in, and a signal triggered at the close of trading on Monday.

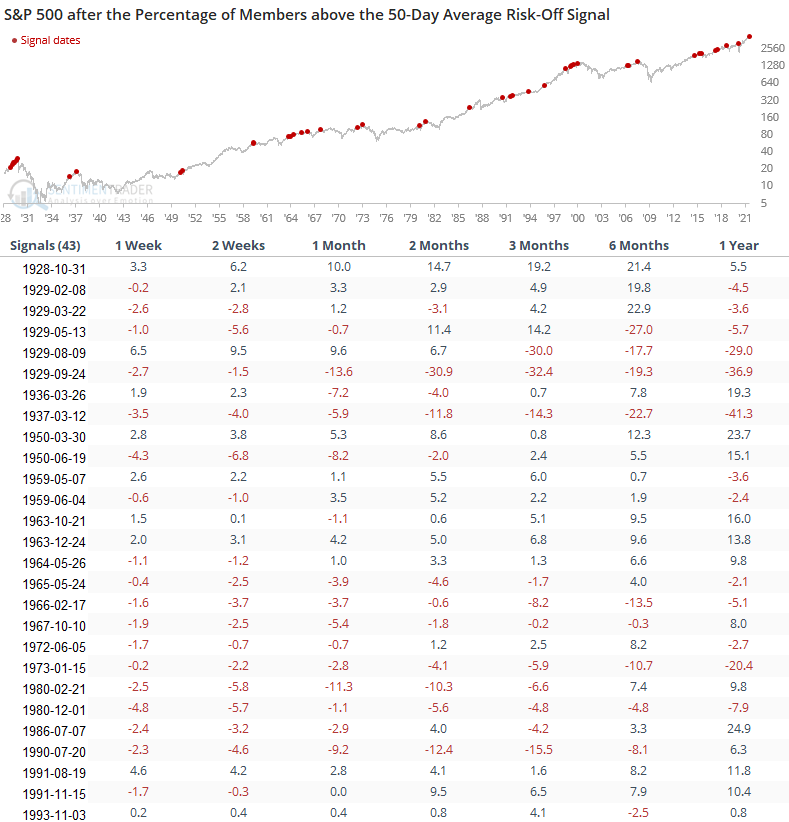
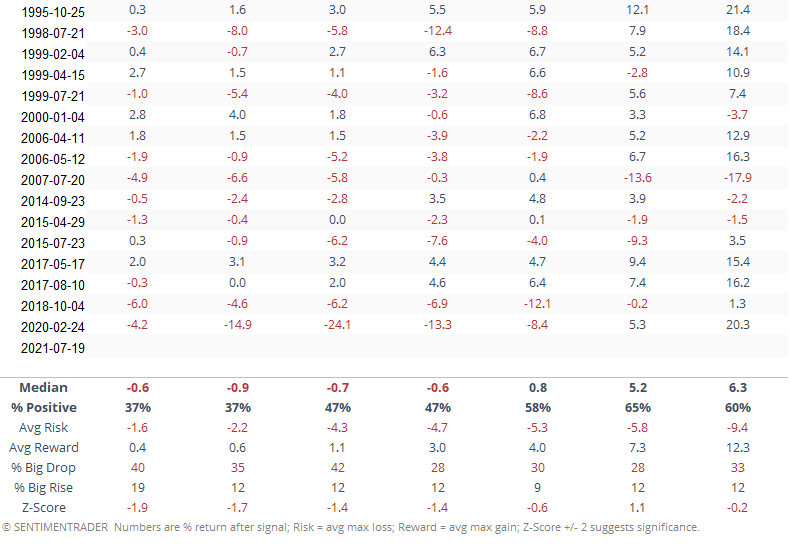
HOW THE SIGNALS PERFORMED

Results are weak across all timeframes and the risk/reward profile looks unfavorable in the 1-2 week window.

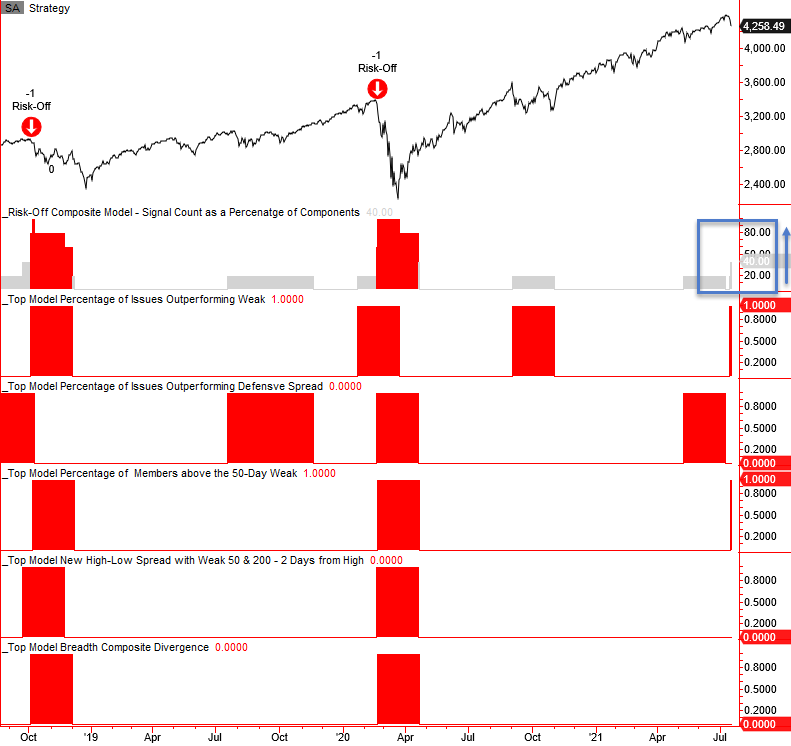
RISK-OFF COMPOSITE MODEL

The signal count as a percentage of components remains below the threshold level of 60% for a composite risk-off warning alert. 

Please remember, the risk-off composite model is not a component in the Tactical Composite Trend Model. I use it as a secondary risk management tool for short-term trading. 

You can follow the TCTM and the Risk-Off Composite Model on the TCTM "Live Page" on the website. Click here.

While the S&P 500 is down less than 3% from its all-time high, several economically sensitive groups are down significantly more and are now showing short-term oversold conditions. I will be monitoring the beaten-down groups for breadth thrusts and other price reversal signals. In particular, energy and airlines.

I have a general rule that says momentum thrusts overrule all else in the short term.

Sorry, you don't have access to this report

Upgrade your subscription plan to get access
Go to Dasboard
PRODUCTS
SentimenTrader
Trading Tools
Indicators & Data API
‍
Strategies & Scanner
‍
Research Reports
FREE
RESOUrCES
Simple Backtest
Calculator
Simple Seasonality
Calculator
The Kelly Criterion
Calculator
Sentiment Geo Map
‍
Public Research Reports
‍
Education
Sentiment Indicators
‍
Technical Indicators
‍
Pricing
Bundle pricing
‍
FAQ
‍
Announcements
‍
COMPANY
‍
About
‍
In the News
‍
Testimonials
‍
Client Success Stories
CONTACT
‍
General Inquiries
‍
Media Inquiries
‍
Financial Professionals Inquiries
‍
© 2026 Sundial Capital Research Inc. All rights reserved.
Setsail Marketing
TermsPrivacyAffiliate Program
Risk Disclosure: Futures and forex trading contains substantial risk and is not for every investor. An investor could potentially lose all or more than the initial investment. Risk capital is money that can be lost without jeopardizing ones’ financial security or life style. Only risk capital should be used for trading and only those with sufficient risk capital should consider trading. Past performance is not necessarily indicative of future results.

Hypothetical Performance Disclosure: Hypothetical performance results have many inherent limitations, some of which are described below. No representation is being made that any account will or is likely to achieve profits or losses similar to those shown; in fact, there are frequently sharp differences between hypothetical performance results and the actual results subsequently achieved by any particular trading program. One of the limitations of hypothetical performance results is that they are generally prepared with the benefit of hindsight. In addition, hypothetical trading does not involve financial risk, and no hypothetical trading record can completely account for the impact of financial risk of actual trading. for example, the ability to withstand losses or to adhere to a particular trading program in spite of trading losses are material points which can also adversely affect actual trading results. There are numerous other factors related to the markets in general or to the implementation of any specific trading program which cannot be fully accounted for in the preparation of hypothetical performance results and all which can adversely affect trading results.

Testimonial Disclosure: Testimonials appearing on this website may not be representative of other clients or customers and is not a guarantee of future performance or success.