Products
SentimenTrader Trading Tools
‍
Backtest Engine
My Trading Toolkit
Correlation Analysis
Seasonality
Indicators & Data API
‍
Proprietary Indicators & Charts
Market Data API
Strategies & Scanner
‍
50+ Trading Strategies
Smart Stock Scanner
Research Reports
‍
Research Solutions
Reports Library
Free Resources
Simple Backtest Calculator
Simple Seasonality Calculator
The Kelly Criterion Calculator
Sentiment Geo Map
Public Research Reports
Pricing
Company
About
In the News
Testimonials
Client Success Stories
Contact
Log inLoginSign up
< BACK TO ALL REPORTS

New lows on the Nasdaq near a 25-year record

Jason Goepfert
2022-01-26
There has been a spike in the percentage of Nasdaq stocks at 52-week lows. On the S&P 500, there is also a spike in lesser lows.

A jump in new lows on the Nasdaq

Despite Monday's reversal, many more stocks on the Nasdaq exchange touched a 52-week low during the day. Now, more than 30% of stocks on the exchange have plunged to that extreme on the same day. That's the 18th-highest figure since 1996.

More than 30% of Nasdaq stocks at 52-week low

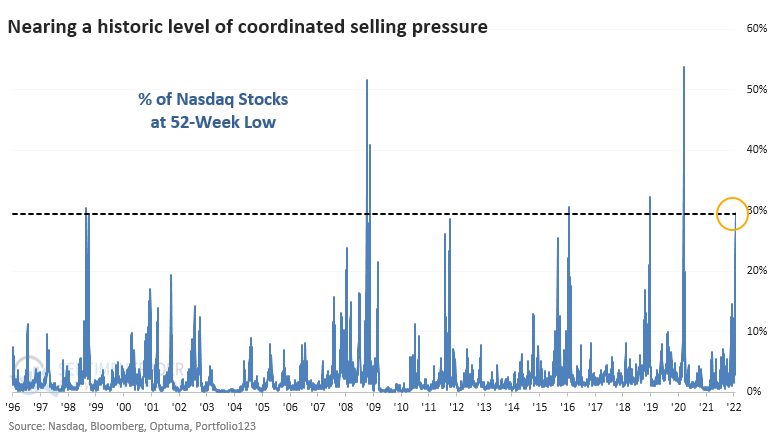
Even though this was exceeded before the final plunges in 2008 and 2020, the Nasdaq Composite's forward returns were impressive. Over the next year, the Nasdaq showed a gain all 17 times.

We focused on the historic level of speculative activity in the options market early last year. In all available data, we'd never seen risk-seeking behavior like that. Since then, many of the riskiest securities have been cut in half.

We've also seen the curious behavior of traders quickly turning bearish or trying to hedge on smaller and smaller declines. That was indeed the case last week. Heading into the weekend, there had never been more put options traded on U.S. exchanges. Protective put volume was more than 100% higher than the average of the past 200 days.

Stat box

Over the past 10 days, the SPY fund that tracks S&P 500 stocks has had an average outflow of more than $1 billion per day. According to our Backtest Engine, there have been 93 other days in the past decade with such a large 10-day outflow, after 83 of which the S&P 500 rallied over the next 3 months.


Multi-timeframe lows among S&P 500 stocks

It's not just the Nasdaq that has been seeing a jump in new lows.

Dean assessed the outlook for the S&P 500 when the percentage of 21, 63 & 252-day lows exceed similar threshold levels to Monday's session. New lows must exceed 73%, 38%, and 5%. 

S&P 500 and 1, 3, and 12 month new lows

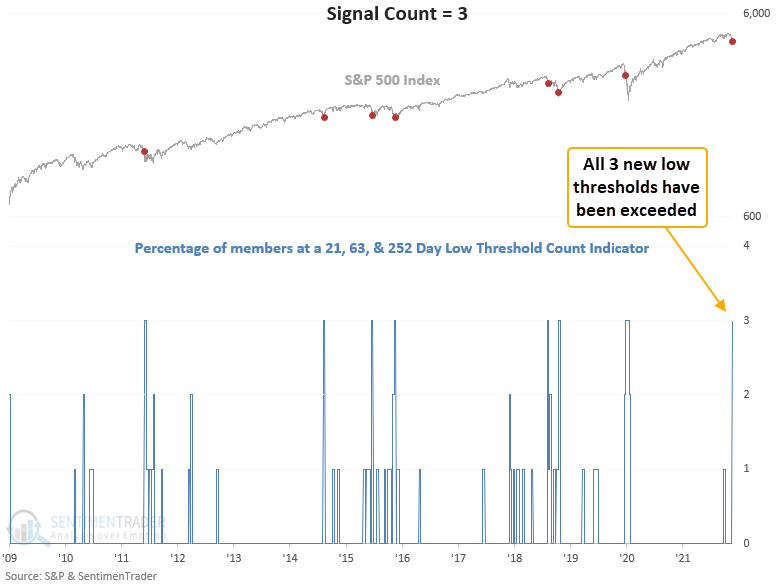
This signal has triggered 50 other times over the past 94 years. After the others, S&P 500 future returns were positive across all time frames, with the best risk/reward profiles coming in the 2 & 6-month windows. However, none of the time frames show a risk/reward profile that looks overwhelmingly appealing, especially given the current level of market volatility.

PRODUCTS
SentimenTrader
Trading Tools
Indicators & Data API
‍
Strategies & Scanner
‍
Research Reports
FREE
RESOUrCES
Simple Backtest
Calculator
Simple Seasonality
Calculator
The Kelly Criterion
Calculator
Sentiment Geo Map
‍
Public Research Reports
‍
Pricing
Bundle pricing
‍
Announcements
‍
FAQ
COMPANY
‍
About
‍
In the News
‍
Testimonials
‍
Client Success Stories
CONTACT
‍
General Inquiries
‍
Media Inquiries
‍
Financial Professionals Inquiries
‍
© 2025 Sundial Capital Research Inc. All rights reserved.
Setsail Marketing
TermsPrivacyAffiliate Program
Risk Disclosure: Futures and forex trading contains substantial risk and is not for every investor. An investor could potentially lose all or more than the initial investment. Risk capital is money that can be lost without jeopardizing ones’ financial security or life style. Only risk capital should be used for trading and only those with sufficient risk capital should consider trading. Past performance is not necessarily indicative of future results.

Hypothetical Performance Disclosure: Hypothetical performance results have many inherent limitations, some of which are described below. No representation is being made that any account will or is likely to achieve profits or losses similar to those shown; in fact, there are frequently sharp differences between hypothetical performance results and the actual results subsequently achieved by any particular trading program. One of the limitations of hypothetical performance results is that they are generally prepared with the benefit of hindsight. In addition, hypothetical trading does not involve financial risk, and no hypothetical trading record can completely account for the impact of financial risk of actual trading. for example, the ability to withstand losses or to adhere to a particular trading program in spite of trading losses are material points which can also adversely affect actual trading results. There are numerous other factors related to the markets in general or to the implementation of any specific trading program which cannot be fully accounted for in the preparation of hypothetical performance results and all which can adversely affect trading results.

Testimonial Disclosure: Testimonials appearing on this website may not be representative of other clients or customers and is not a guarantee of future performance or success.