New Low Spike Model
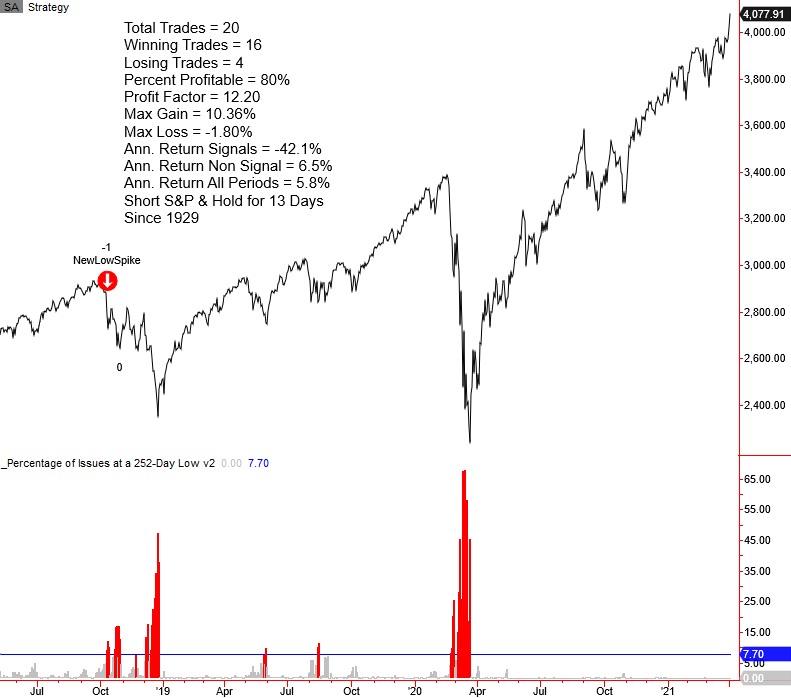
In notes on Tuesday, Wednesday, and Thursday of last week, I reviewed three components in the TCTM Risk Warning Model. Today, I want to share another TCTM Risk Warning Model that utilizes the percentage of S&P 500 members registering a 252-day low. Before I review the model, I want to discuss two crucial points related to today's note. First, I often see market commentary about low levels or divergences in new highs. As we've seen of late, a low level of new highs can signal internal rotation. It's not necessarily an outright negative for the market. While the percentage of new highs will almost always start to shrink and diverge from an index making new highs around inflection points, new lows are the most critical time series to monitor in a market uptrend. If an index is advancing and new lows are expanding, market breadth is unhealthy, and one should take note. The second point I want to make has to do with the indexes and exchanges I monitor for new lows. My models utilize the S&P 500 index and NYSE exchange news lows as they represent high-quality issues. If the high-quality issues are faltering, something is wrong.
Components
Percentage of S&P 500 Members registering a 252-Day Low
New Low Spike Model
The new low spike model seeks to identify instances in history when the percentage of S&P 500 members registering a 252-day low exceeds a user-defined threshold as the S&P 500 Index is still near a 252-day high. The model will issue an alert based upon the following conditions.
Signal Criteria
Condition1 = Percentage of S&P 500 members registering a 252-day low cross above 7.7%.
Condition2 = S&P 500 Index is down less than 5% from a 252-day high.
Condition3 = Percentage of S&P 500 members registering a 252-day low resets below 0.5%. i.e., the reset screens out duplicate signals.
If Condition 1-3, signal risk-off.
Let's take a look at some charts and the historical signal performance.
Current Day Chart Example
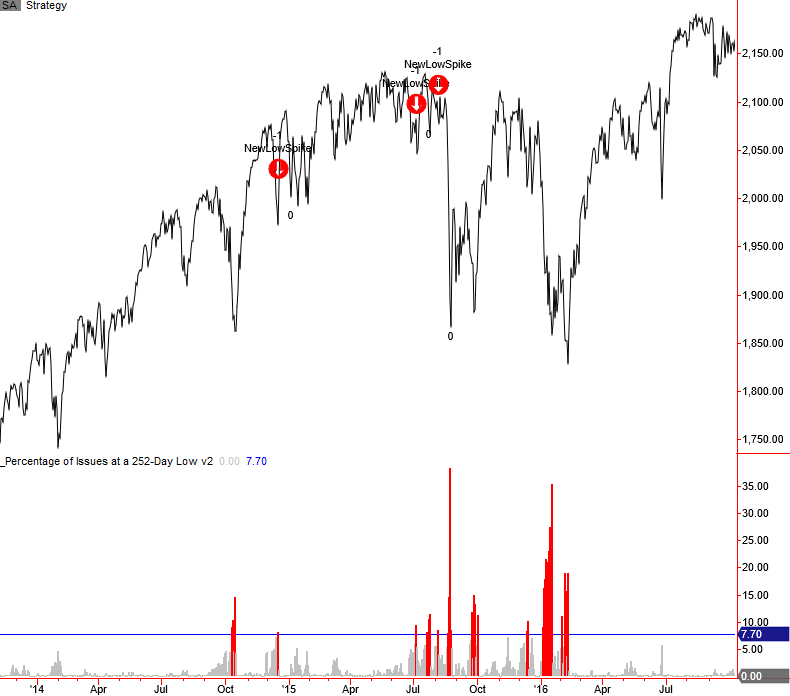
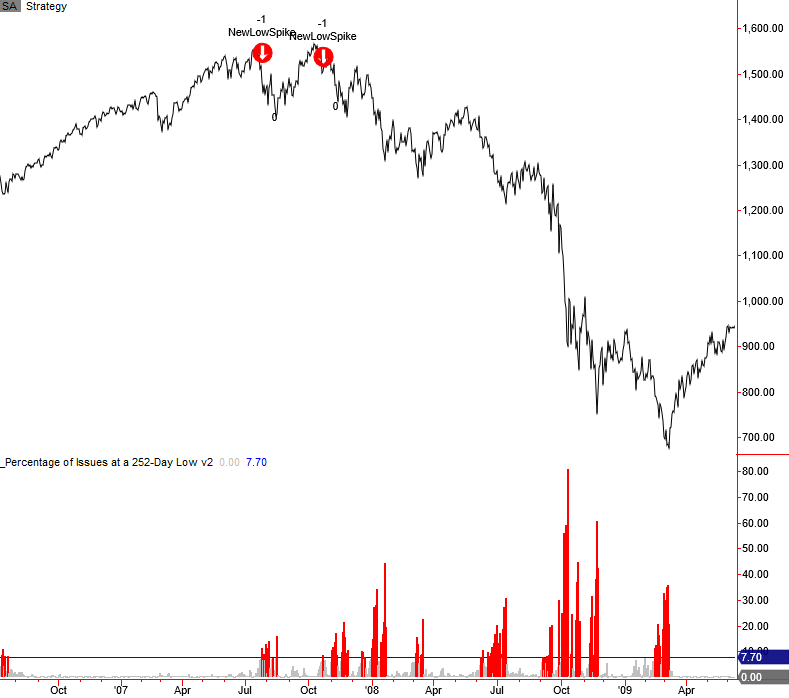
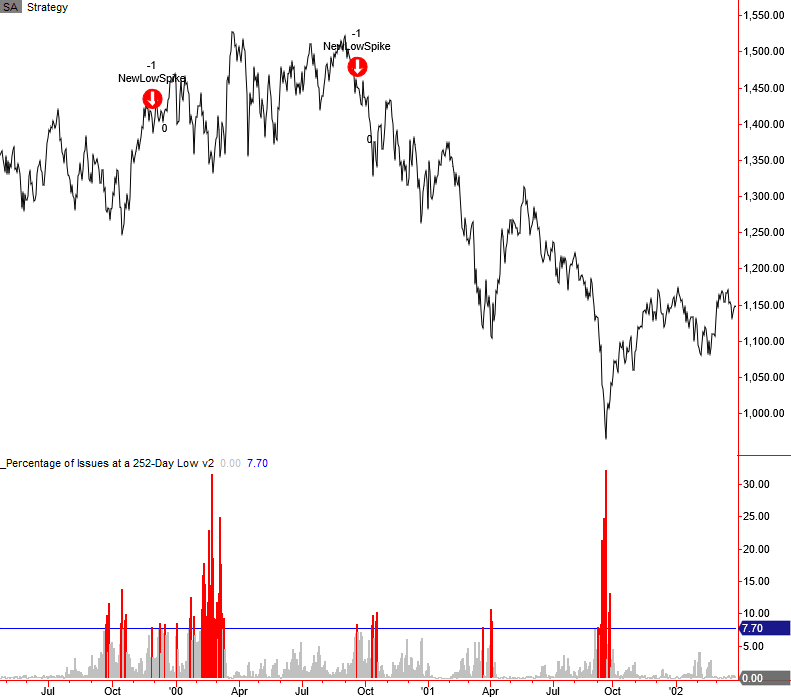
Please note, I calculate performance statistics in the chart as a short signal, whereas annualized returns result from buying the S&P 500.

2015-16 Oil/Commodity Bear
2007-08 Financial Crisis
2000 Internet Bubble
1998 LTCM
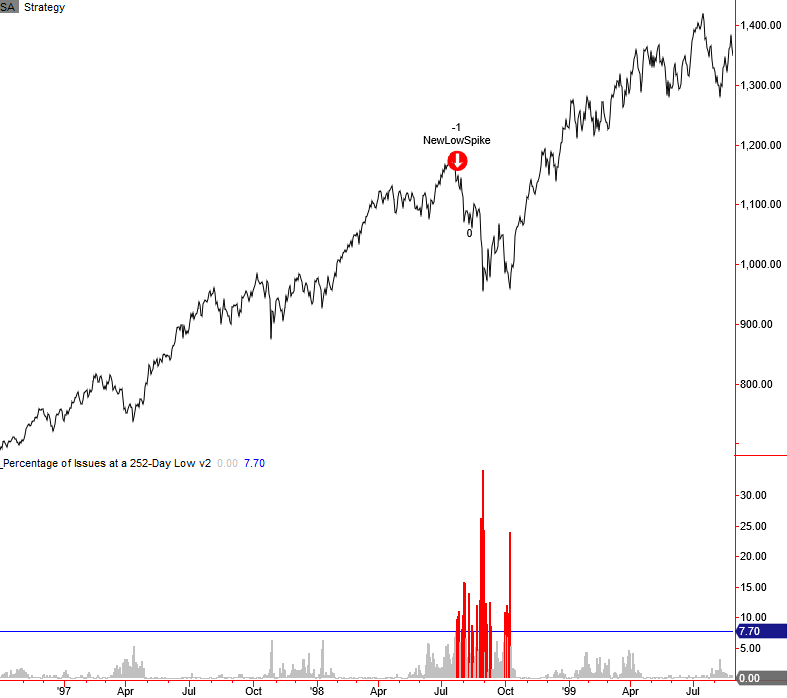
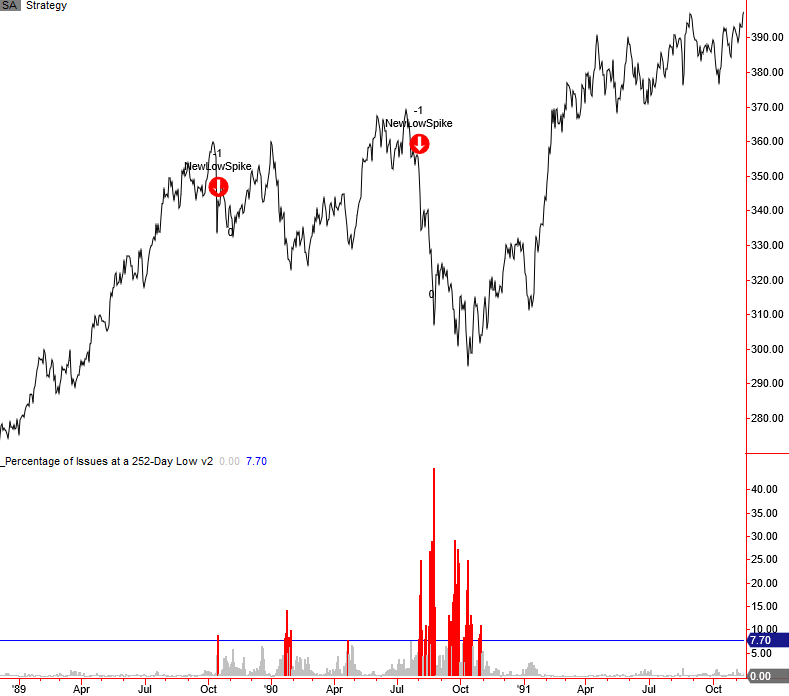
1990 Savings & Loan/Iraq Oil Spike
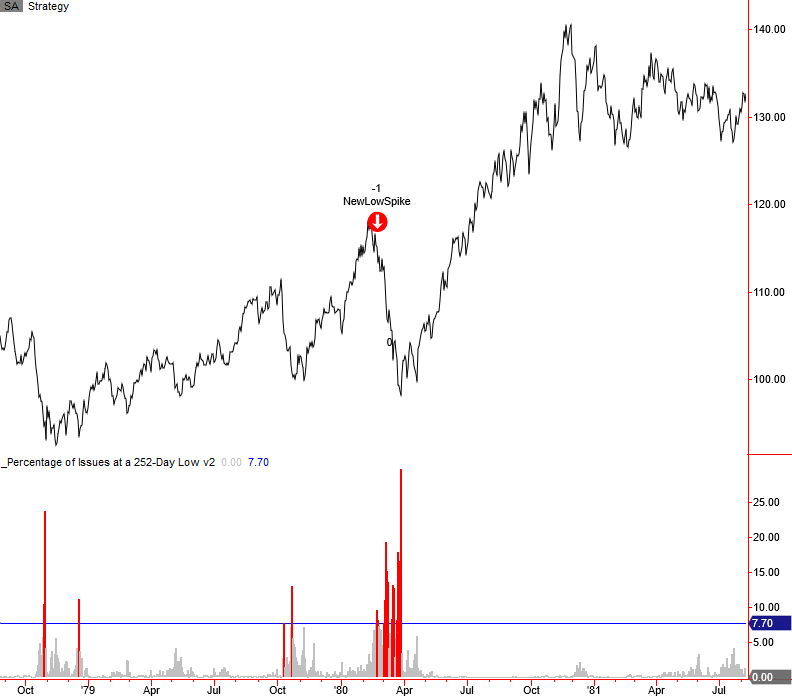
1980 Correction
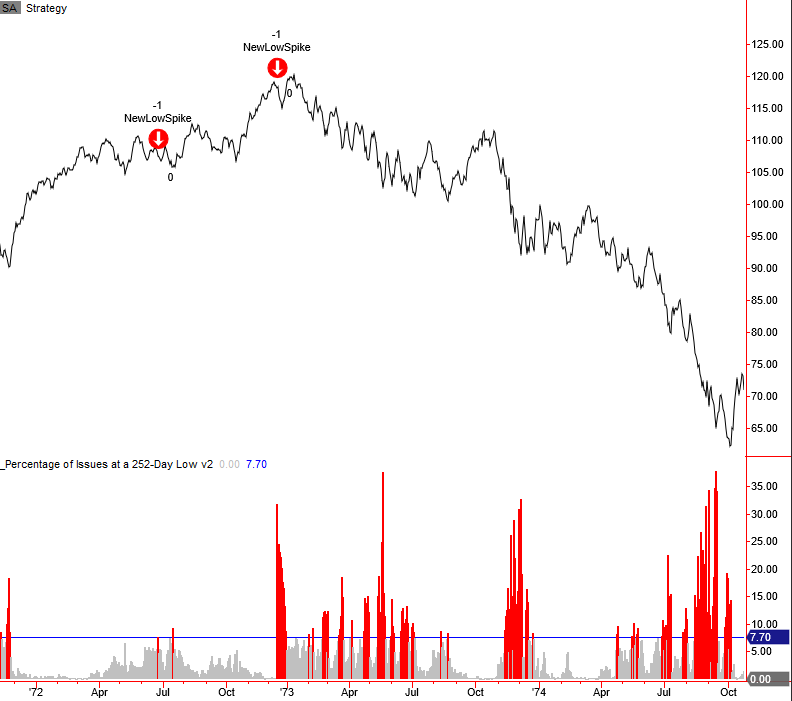
1973-74 Bretton Woods/Nixon Shock/Oil Crisis
1966 Bear Market
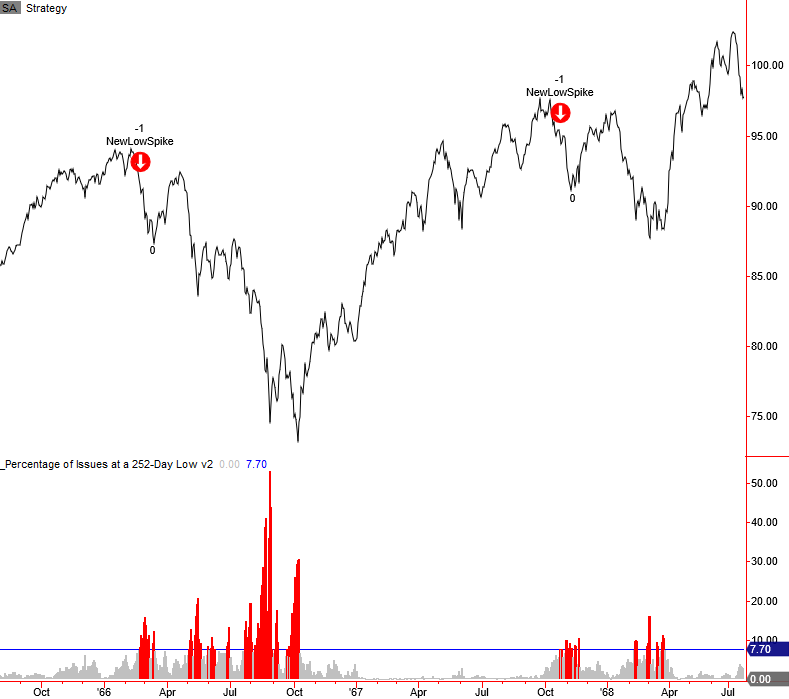
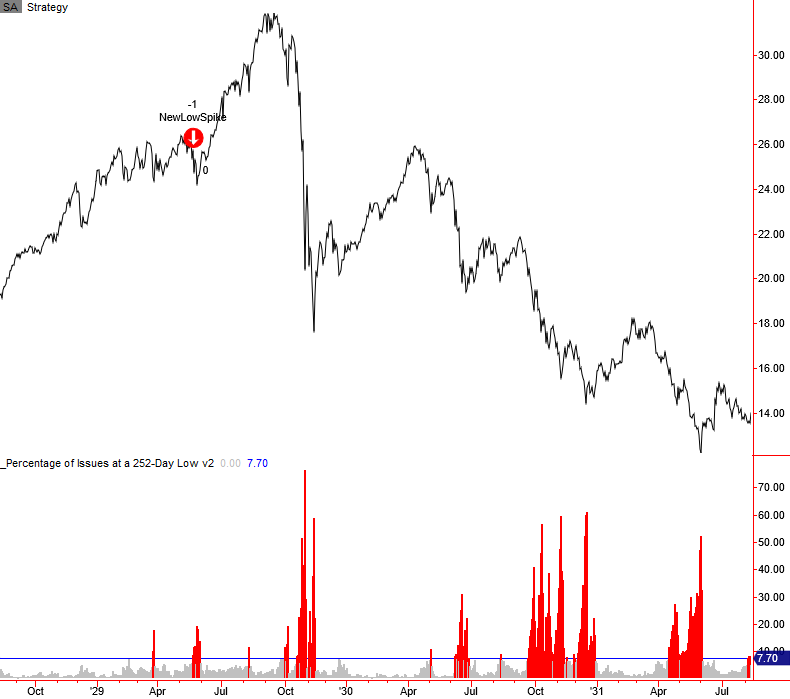
1929-32 Bear Market
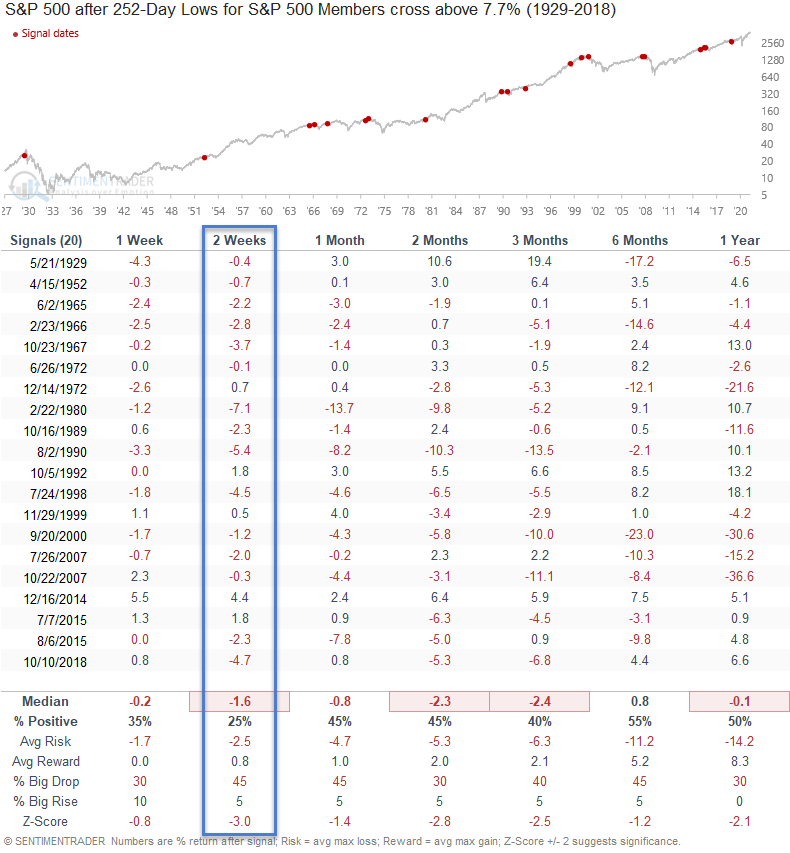
Signal Performance
As one can see, performance is weak across all timeframes with a notable z-score in the 2-week timeframe. The weak results highlight why I favor the new lows list over monitoring new highs.
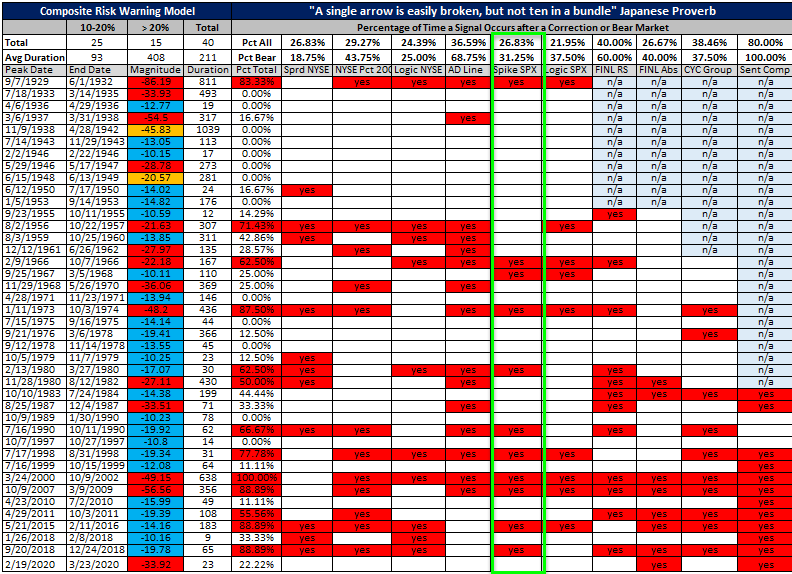
Historical TCTM Risk Warning Model Table
Conclusion: The S&P 500 new low spike model is unlikely to trigger a new signal anytime soon as a majority of index members are trading significantly above a rolling 252-day low post the pandemic crash and recovery.

