Products
SentimenTrader Trading Tools
‍
Backtest Engine
My Trading Toolkit
Correlation Analysis
Seasonality
Market Prediction
Indicators & Data API
‍
Proprietary Indicators & Charts
Market Data API
Strategies & Scanner
‍
50+ Trading Strategies
Smart Stock Scanner
Smart Option Scanner
Research Reports
‍
Research Solutions
Reports Library
Free Resources
Simple Backtest Calculator
Simple Seasonality Calculator
The Kelly Criterion Calculator
Sentiment Geo Map
Public Research Reports
Education
Sentiment Indicators
Technical Indicators
Pricing
Company
About
In the News
Testimonials
Client Success Stories
Contact
Log inLoginSign up
< BACK TO ALL REPORTS

New Low Spike; Heavy Selling Cluster

Jason Goepfert
2018-12-20
null

As we head into the close on yet another dreadful day for stocks, along with almost everything else, there are a few things that are worth noting.

Most importantly, there is clear evidence of wholesale selling on a level we rarely see. Since 1984, as far back as we can go, there have been only 8 other days that showed more 52-week lows as a percentage of total issues combined on the NYSE and Nasdaq exchanges. All of those 8 sessions were either in October 1987 or October/November 2008. So in that sense, what we're seeing here is on a par with the two greatest crashes in the past 40 years.

Here are all days when the combined new low percentage was at least 35% of all issues.

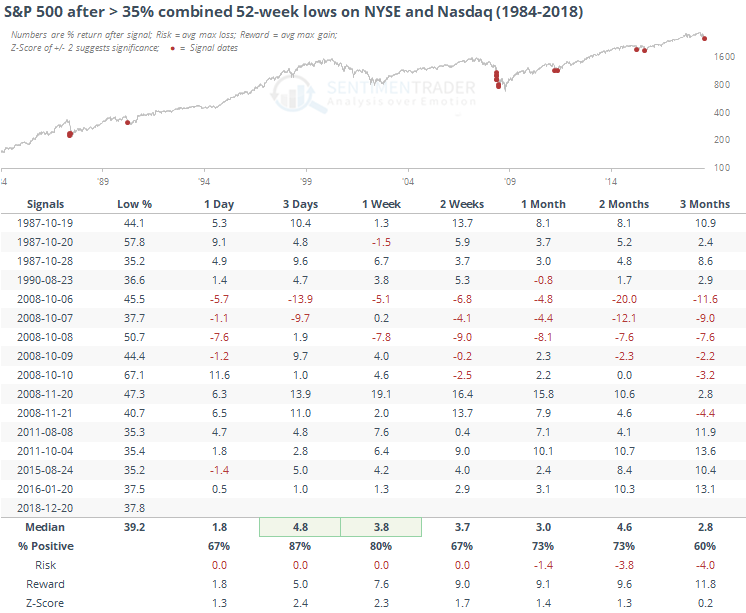
Except for the meltdown in early October 2008, the led to quick rebounds in the S&P.

If we just look at the NYSE, then we can go back to 1965. And using just that exchange, today's figure is even more extreme, at more than 40% of all securities traded. This will not get better before the close, it can only get worse, so it's safe to say that we've hit this extreme today.

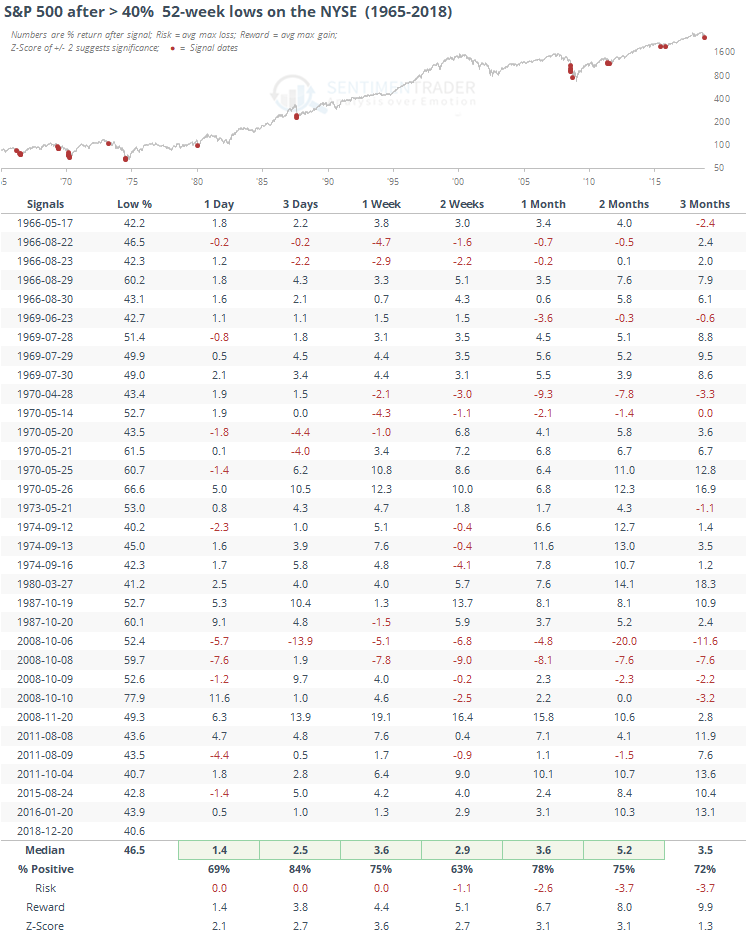
With a larger sample size, there is still a distinct tendency to rebound in the days and weeks ahead.

The S&P is on track for one of the worst multi-day stretches of selling in its history. This is the first time since 2008 that 3 out of the past 4 sessions suffered a loss of 1.5% or more to a 52-week low. Most of the others were in the 1930s.

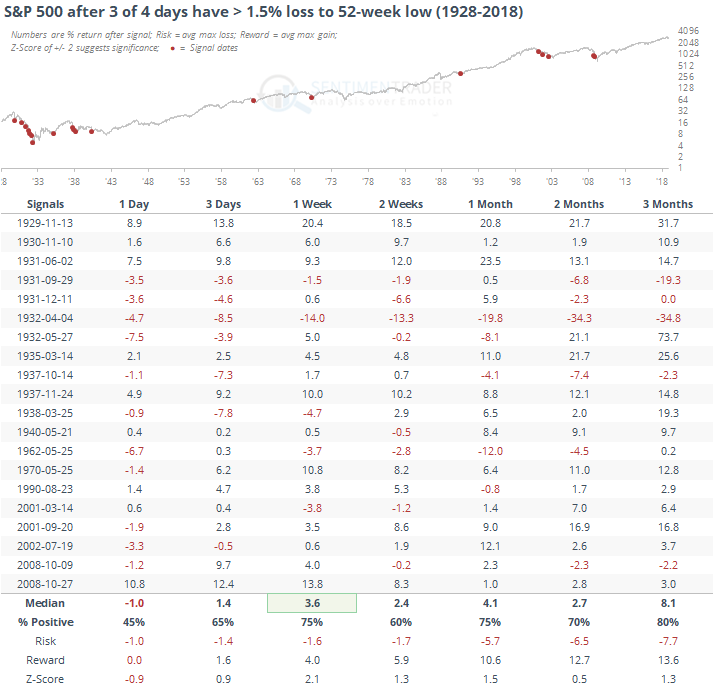
During more modern markets, there was still some very short-term selling pressure, but rebounds the majority of the time in the days and weeks ahead, even during the worst bear markets in the past 20 years.

We should be nearing the final puke phase of this decline, especially when looking at some of the preliminary discounts that are being forced on some funds. There are more than hints of panic in the air today.

PRODUCTS
SentimenTrader
Trading Tools
Indicators & Data API
‍
Strategies & Scanner
‍
Research Reports
FREE
RESOUrCES
Simple Backtest
Calculator
Simple Seasonality
Calculator
The Kelly Criterion
Calculator
Sentiment Geo Map
‍
Public Research Reports
‍
Education
Sentiment Indicators
‍
Technical Indicators
‍
Pricing
Bundle pricing
‍
FAQ
‍
Announcements
‍
COMPANY
‍
About
‍
In the News
‍
Testimonials
‍
Client Success Stories
CONTACT
‍
General Inquiries
‍
Media Inquiries
‍
Financial Professionals Inquiries
‍
© 2026 Sundial Capital Research Inc. All rights reserved.
Setsail Marketing
TermsPrivacyAffiliate Program
Risk Disclosure: The information and tools provided are for research and analytical purposes only and are not intended as investment advice. Market analysis involves uncertainty, and outcomes may differ from expectations. Users should conduct their own due diligence and consider their individual circumstances before making any financial decisions. Past performance is not necessarily indicative of future results.

Hypothetical Performance Disclosure: Hypothetical performance results have many inherent limitations, some of which are described below. No representation is being made that any account will or is likely to achieve profits or losses similar to those shown; in fact, there are frequently sharp differences between hypothetical performance results and the actual results subsequently achieved by any particular trading program. One of the limitations of hypothetical performance results is that they are generally prepared with the benefit of hindsight. In addition, hypothetical trading does not involve financial risk, and no hypothetical trading record can completely account for the impact of financial risk of actual trading. for example, the ability to withstand losses or to adhere to a particular trading program in spite of trading losses are material points which can also adversely affect actual trading results. There are numerous other factors related to the markets in general or to the implementation of any specific trading program which cannot be fully accounted for in the preparation of hypothetical performance results and all which can adversely affect trading results.

Testimonial Disclosure: Testimonials appearing on this website may not be representative of other clients or customers and is not a guarantee of future performance or success.