Products
SentimenTrader Trading Tools
‍
Backtest Engine
My Trading Toolkit
Correlation Analysis
Seasonality
Market Prediction
Indicators & Data API
‍
Proprietary Indicators & Charts
Market Data API
Strategies & Scanner
‍
50+ Trading Strategies
Smart Stock Scanner
Smart Option Scanner
Research Reports
‍
Research Solutions
Reports Library
Free Resources
Simple Backtest Calculator
Simple Seasonality Calculator
The Kelly Criterion Calculator
Sentiment Geo Map
Public Research Reports
Education
Sentiment Indicators
Technical Indicators
Pricing
Company
About
In the News
Testimonials
Client Success Stories
Contact
Log inLoginSign up
< BACK TO ALL REPORTS

New highs versus new lows flash green for NDX and SPX

Jay Kaeppel
2024-10-17
Momentum is an important factor in the stock market. New highs versus new lows for the Nasdaq 100 and S&P 500 Index are presently conveying important information. We present the details herein.

Key points

  • Sustainable bull markets require participation among a broad array of individual stocks
  • One way to monitor participation is in the number of stocks making new 52-week highs versus new 52-week lows
  • Both the Nasdaq 100 and S&P 500 indexes are presently showing strong high/low numbers

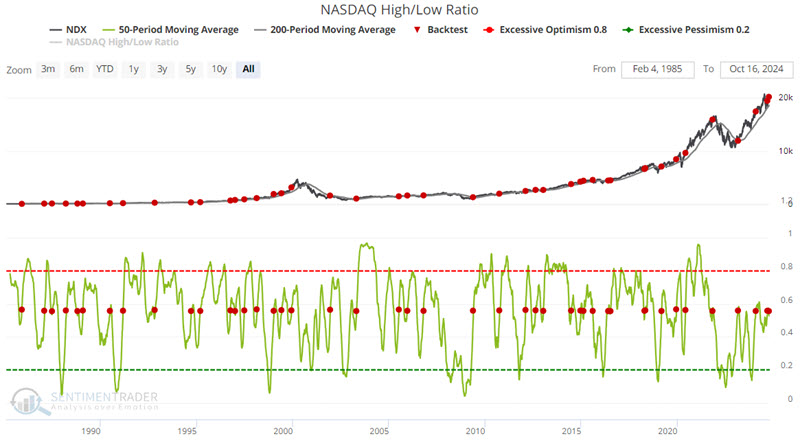
The Nasdaq High/Low Ratio flashes green

This breadth ratio is constructed from the New High / New Low Ratio. New highs are the number of NASDAQ issues that closed at a new 52-week high today. New lows are the number of NASDAQ issues that reached a new 52-week low as of today's close. It is expressed as the number of issues that closed at a new high as a percentage of the total (we also present the ratio chart for the Nasdaq).

For example, on any given day, if there were 100 issues which closed at a new high and 30 which closed at a new low, then the new high percentage would be:

100 / (100 + 30) = 100 / 130 = 77%

The ratio can gyrate wildly from day to day, so it's often useful to plot a moving average. While this is generally viewed as an overbought/oversold indicator, there are other ways to interpret the data.

The chart below highlights all dates when the 50-day moving average of the Nasdaq High/Low Ratio crossed above 0.56. The most recent signal occurred on 2024-10-15.

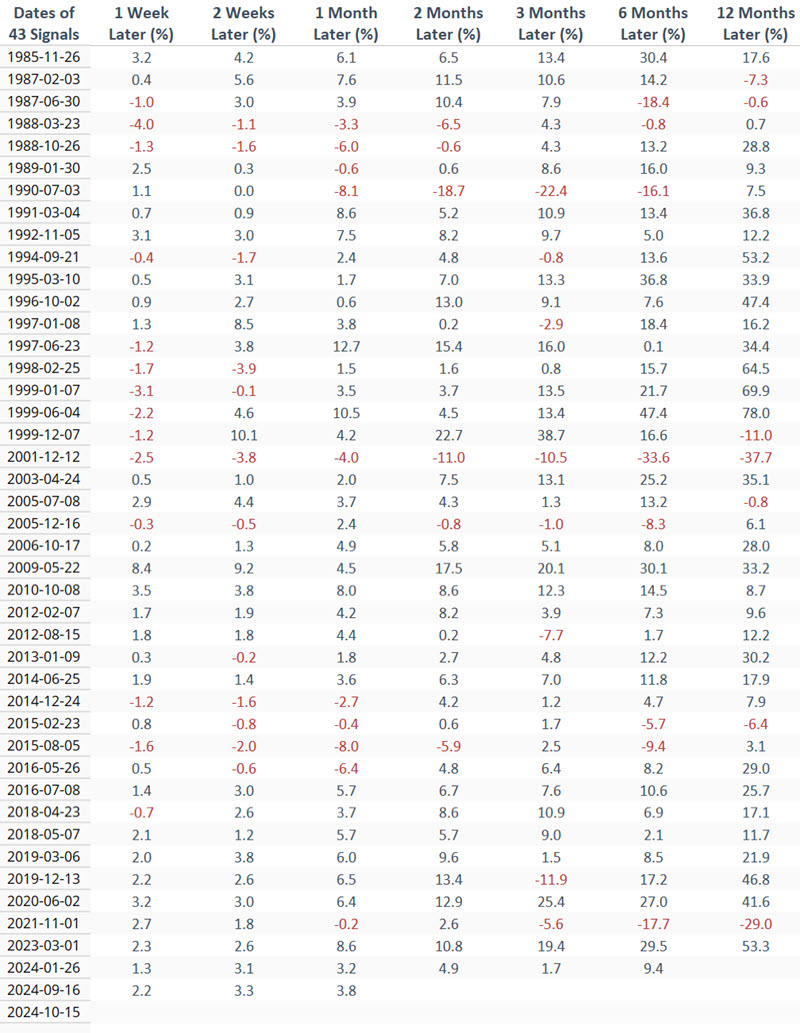
The table below displays subsequent Nasdaq 100 performance on a signal-by-signal basis.

The table below summarizes subsequent performance for the Nasdaq 100 Index.

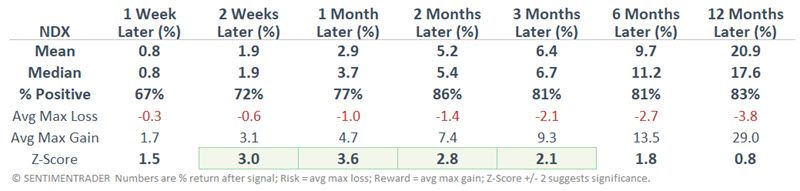
This signal should not be used as an automatic trading system. Still, it can alert momentum investors that a decisive move will likely follow through to the upside.

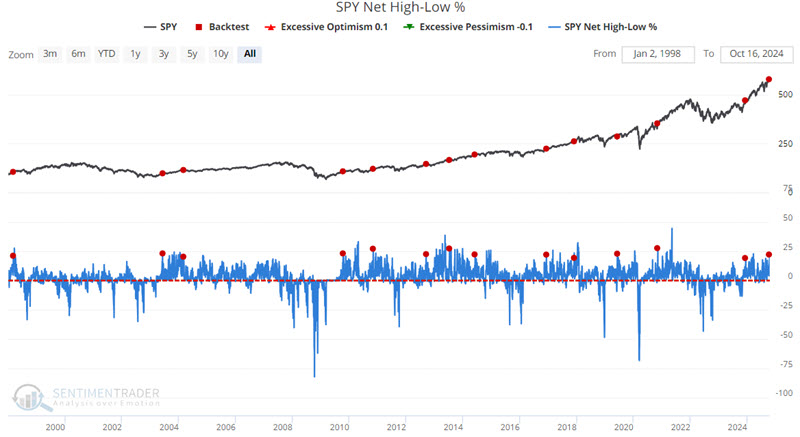
The SPY Net High-Low % indicator flashes a similar signal

This indicator is similar to the one highlighted above but uses the constituent stocks of ticker SPDR Trust ETF (ticker SPY) instead of the Nasdaq 100 Index and a slightly different calculation to highlight times when market momentum is strong and likely to follow through to the upside. This indicator shows the net percentage of SPY securities trading at a 52-week high minus the percentage trading at a 52-week low.

The chart below highlights those dates when the indicator value crossed above 19% for the first time in nine months. The most recent signal occurred on 2024-10-15.

The table below displays subsequent SPY performance on a signal-by-signal basis.

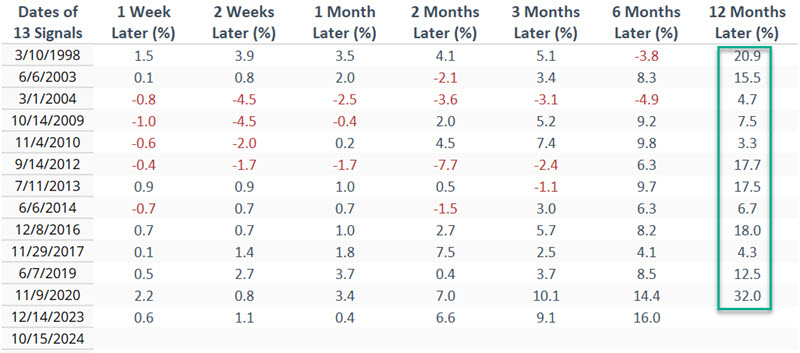
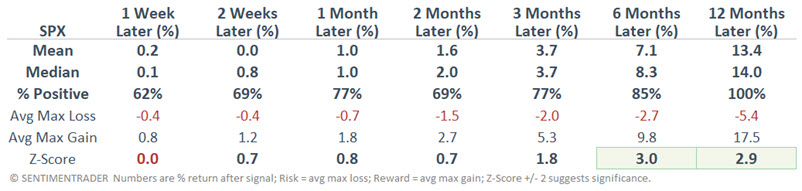
The table below summarizes the subsequent performance for ticker SPY.

What the research tells us…

It's almost getting a little "too easy" for stock market investors to make money. Just get in, wait another week or month, and count your compounding profits. That said, momentum is a real thing in the stock market. When the market anticipates a better economic environment and thus higher corporate profits, the major indexes run to new highs - AND, most importantly - a large percentage of individual stocks also participate. The two indicators above strongly suggest that this is the environment we are in at present. While that does not guarantee higher prices "this time," history suggests that that is the way to bet.

PRODUCTS
SentimenTrader
Trading Tools
Indicators & Data API
‍
Strategies & Scanner
‍
Research Reports
FREE
RESOUrCES
Simple Backtest
Calculator
Simple Seasonality
Calculator
The Kelly Criterion
Calculator
Sentiment Geo Map
‍
Public Research Reports
‍
Education
Sentiment Indicators
‍
Technical Indicators
‍
Pricing
Bundle pricing
‍
FAQ
‍
Announcements
‍
COMPANY
‍
About
‍
In the News
‍
Testimonials
‍
Client Success Stories
CONTACT
‍
General Inquiries
‍
Media Inquiries
‍
Financial Professionals Inquiries
‍
© 2026 Sundial Capital Research Inc. All rights reserved.
Setsail Marketing
TermsPrivacyAffiliate Program
Risk Disclosure: The information and tools provided are for research and analytical purposes only and are not intended as investment advice. Market analysis involves uncertainty, and outcomes may differ from expectations. Users should conduct their own due diligence and consider their individual circumstances before making any financial decisions. Past performance is not necessarily indicative of future results.

Hypothetical Performance Disclosure: Hypothetical performance results have many inherent limitations, some of which are described below. No representation is being made that any account will or is likely to achieve profits or losses similar to those shown; in fact, there are frequently sharp differences between hypothetical performance results and the actual results subsequently achieved by any particular trading program. One of the limitations of hypothetical performance results is that they are generally prepared with the benefit of hindsight. In addition, hypothetical trading does not involve financial risk, and no hypothetical trading record can completely account for the impact of financial risk of actual trading. for example, the ability to withstand losses or to adhere to a particular trading program in spite of trading losses are material points which can also adversely affect actual trading results. There are numerous other factors related to the markets in general or to the implementation of any specific trading program which cannot be fully accounted for in the preparation of hypothetical performance results and all which can adversely affect trading results.

Testimonial Disclosure: Testimonials appearing on this website may not be representative of other clients or customers and is not a guarantee of future performance or success.