
New Highs and Lows flashing an important - and typically early - sign

Key Points
- It is generally considered bearish when Nasdaq new lows exceed Nasdaq new highs
- However, there comes the point when the action becomes so one-sided that a reversal of fortune becomes highly likely
- New Highs/New Lows is a good way to identify when a "wash out" is near and that a reversal is possible
- However, it is important to recognize that signals typically occur when volatility - and fear and uncertainty - are at their highest, as the market plunges to a meaningful bottom
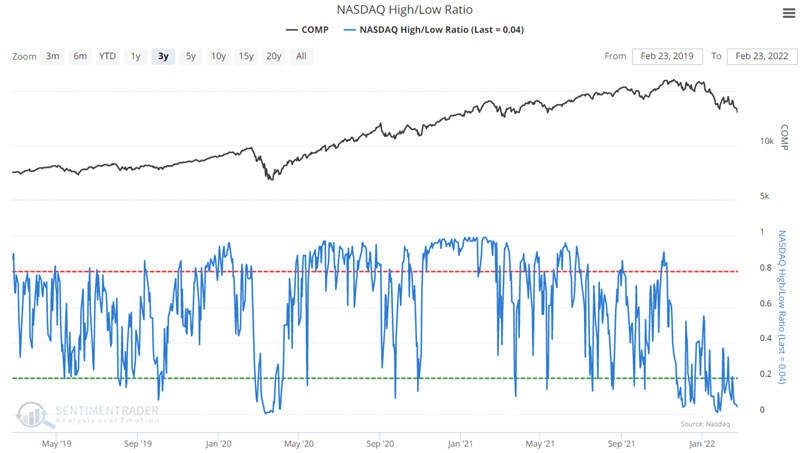
NASDAQ High/Low Ratio
New highs are the number of NASDAQ issues that reached a new 52-week high today. New lows are the number of NASDAQ issues that reached a new 52-week low today. This indicator is a breadth ratio constructed from these two values and is expressed as the number of issues that closed at a new high as a percentage of the total number of stocks making new highs or new lows.
The chart below displays the daily readings for the last three years.
Now let's look at one way to identify more extreme - and potentially favorable - situations.
3-day average reaches an extreme
The chart below displays those days when the 3-day average of daily Nasdaq High/Low Ratio readings dropped below 0.02. In other words, over the three previous trading days, less than 2% of Nasdaq stocks making new highs or lows were making new highs. This tends to occur when the overall market is reaching a "washed out" level. You can run this test in the Backtest Engine.
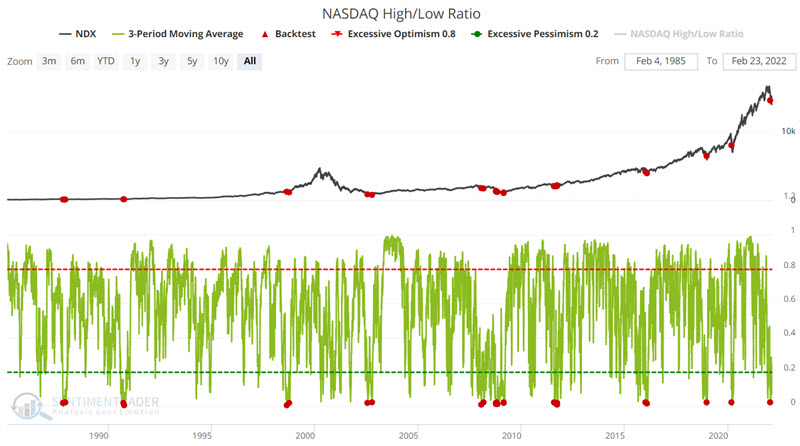
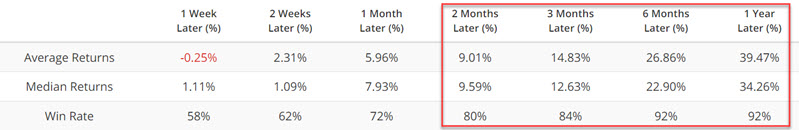
The latest signal occurred on 1/24/2022. The table below displays a summary of the results following all signals (including overlaps).
Another perspective on performance
Let's consider the following approach to using these signals:
- Each time the 3-day average drops below 0.02, we will hold the Nasdaq 100 Index for 126 trading days (6 months x roughly 21 trading days per month)
- If a new signal occurs while an existing signal is active, the holding period is extended for another 126 trading days
So if only one signal occurs, the holding period will be 126 trading days (i.e., roughly six months). If there are overlapping signals, the holding period will be longer.
The chart below displays the hypothetical growth of $1 invested in the Nasdaq 100 Index only as described above.
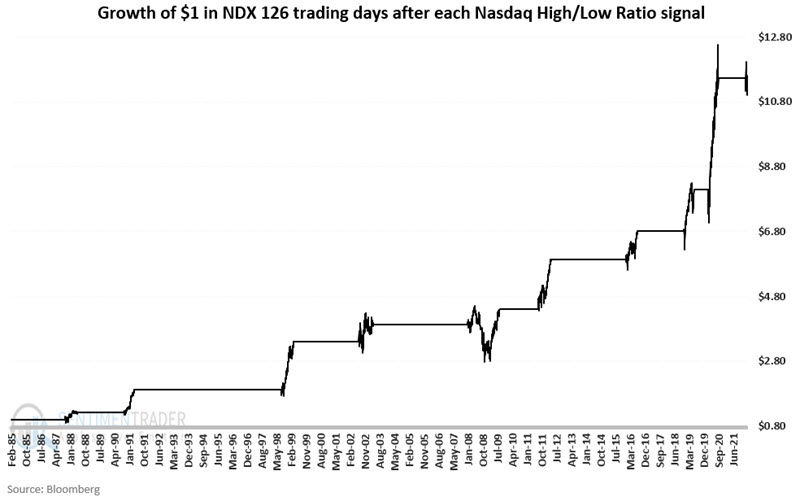
From one perspective, the results are outstanding. Consider:
- The average holding period return is +29.5%
- The median holding period return is +20.7%
- 9 out of 10 signals (90%) showed a gain
- The worst holding period return was -3.8%
Sounds pretty great, right?
Based on these numbers, it is fair to say that the "net results" are fairly impressive. And if my primary purpose were to impress my friends and neighbors, I would probably leave it at that. But the real primary purpose is to help readers become more successful traders and investors. This requires a slightly deeper discussion regarding the realities of trading.
How much heat can you withstand?
The good news is that the signal above does a pretty good job of coming close to market bottoms in terms of "time." And six months later, things typically turn out pretty well. But market bottoms can be extremely volatile and very messy affairs.
Sometimes they play out as straight-line declines that seem like they will never end. Other times the market creates a bottom, gives the impression that the worst is over, and then another harrowing down leg either retests - or exceeds - the previous low, leaving the last of the frightened sellers running for the exits.
The bottom line: being early for a bottom can require you to withstand a great deal of mental - and financial - pressure.
The table below displays the start and end dates for each favorable period using the rules above, along with the percentage +(-) for the Nasdaq 100 Index during the favorable period. It also shows the maximum drawdown for NDX between the entry signal and the actual bottom and the number of trading days it took to get there.
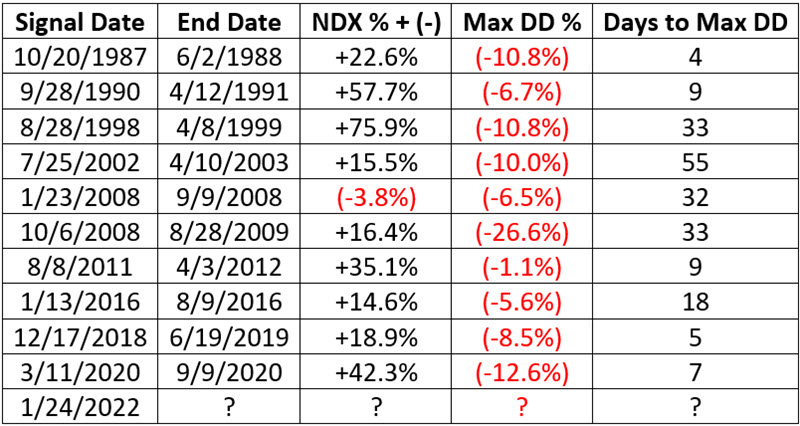
While the end result is inarguably positive, "getting there" is another topic:
- The average maximum drawdown from the time of entry is -9.9%
- The median maximum drawdown from the time of entry is -9.3%
- The average number of trading days to the maximum drawdown (i.e., the actual ultimate low) is 20.5 days
- The median number of trading days to the maximum drawdown 13.5 days
So basically, picture buying into the teeth of a major stock market decline and then envision riding it down another harrowing -10% over the next 2 to 3 weeks. This is psychologically one of the most difficult to endure scenarios for any investor - as the fear surrounding the market will be at its highest.
The realities of trading
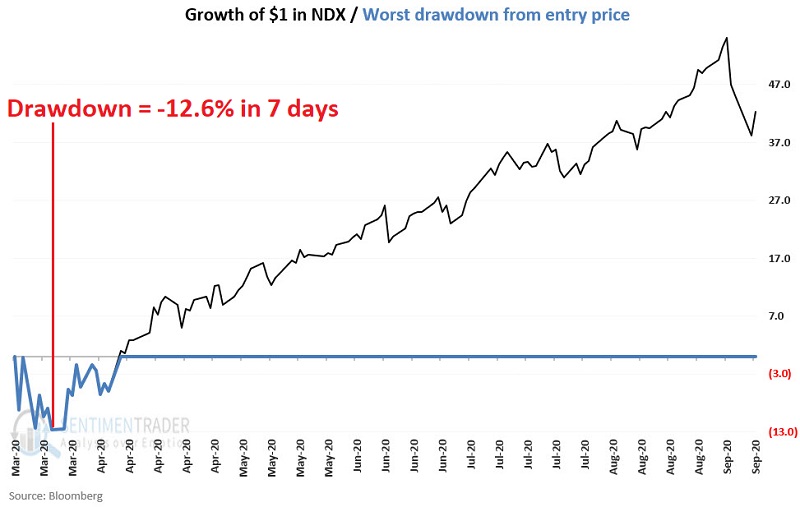
Now let's talk "reality of trading." To illustrate with an example, let's consider the signal on 3/11/2020. Mathematically speaking, a trader who bought on this date and sold 126 trading days later on 9/9/2020 would have gained a whopping 42% over six months. Pretty great, right?
But let's not forget what this entailed:
- Buying into the teeth of what was already a -17.6% decline in 15 trading days
- Holding on to a long position while NDX lost another -12.6% in just seven trading days
- In the face of a pandemic and government-mandated lockdowns and peak uncertainty
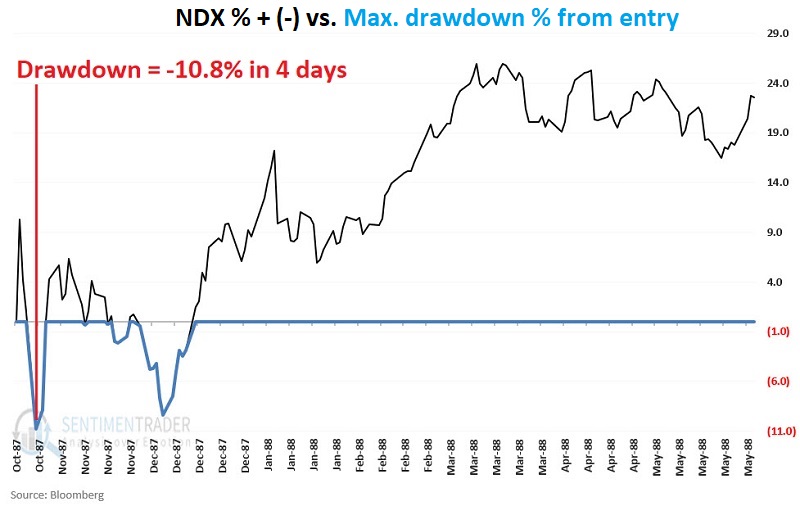
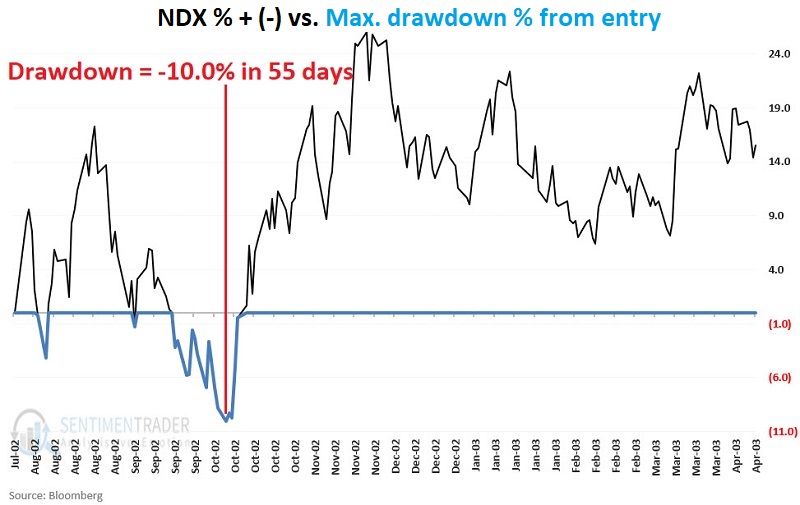
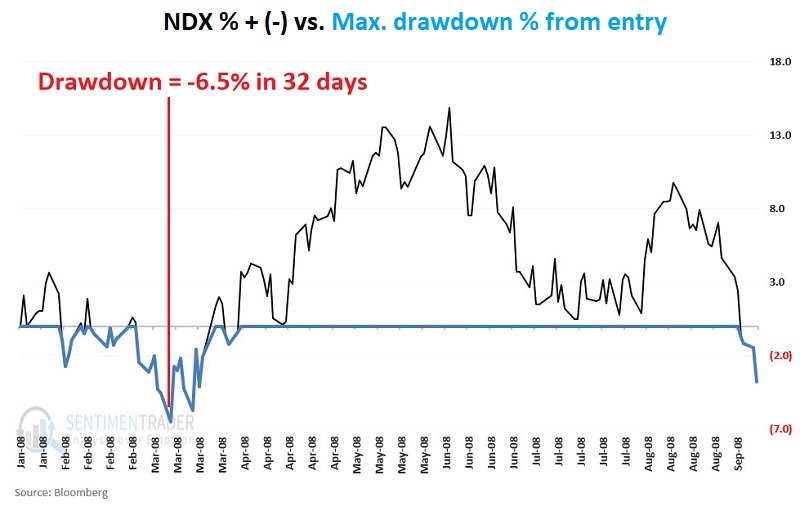
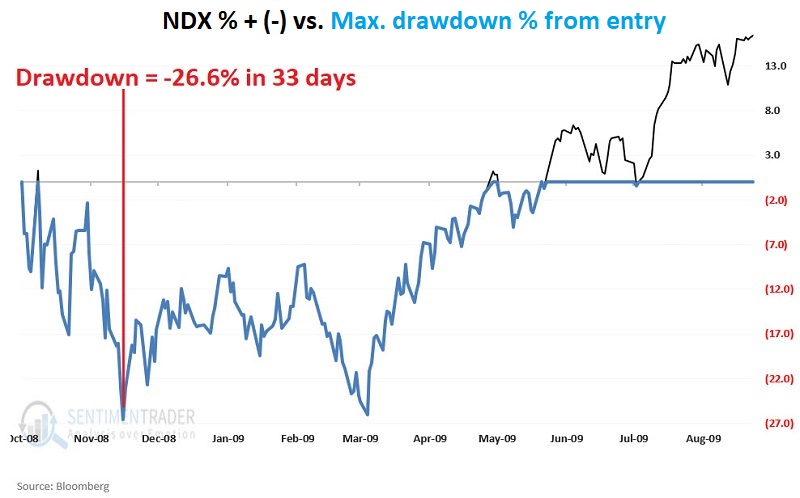
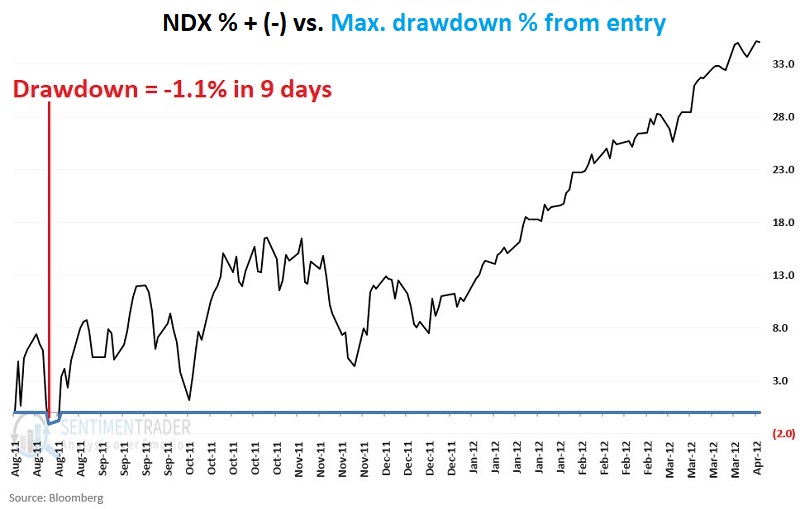
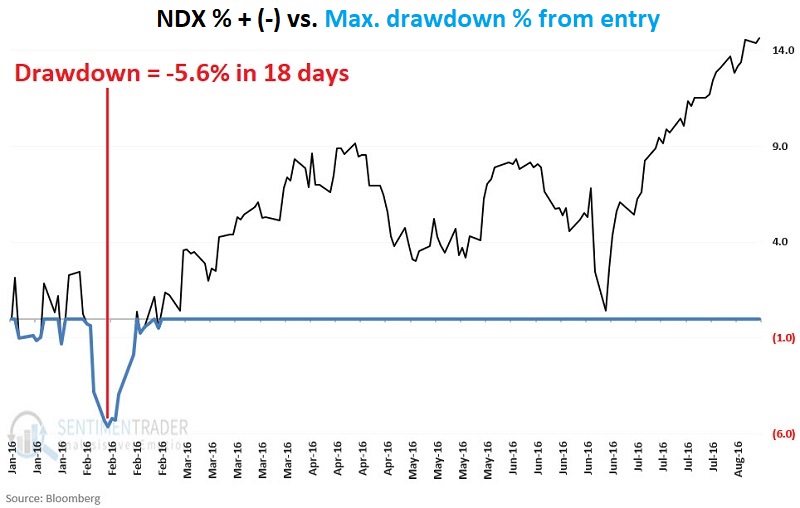
Easier said than done. The charts that follow display the cumulative % +(-) for NDX during each previous bullish period and the maximum drawdown from entry experienced during each period. Only one period experienced a drawdown of no worse than -5.6%, and half of them experienced a drawdown over -10%.
Signal date: 10/20/1987
NDX % +(-): +22.6%
Max. % Drawdown from entry: (-10.8%)
Signal date: 9/28/1990
NDX % +(-): +57.7%
Max. % Drawdown from entry: (-6.7%)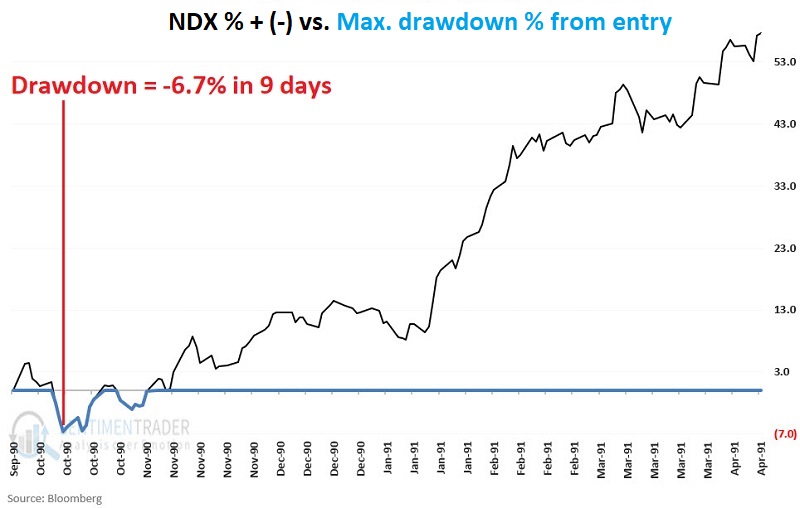
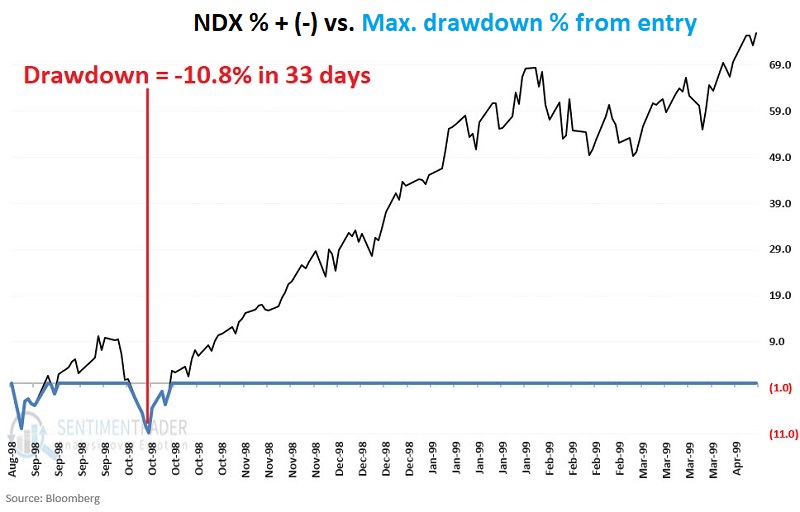
Signal date: 8/28/1998
NDX % +(-): +75.9%
Max. % Drawdown from entry: (-10.8%)
Signal date: 7/25/2002
NDX % +(-): +15.5%
Max. % Drawdown from entry: (-10.0%)
Signal date: 1/23/2008
NDX % +(-): (-3.8%)
Max. % Drawdown from entry: (-6.5%)
Signal date: 10/6/2008
NDX % +(-): +16.4%
Max. % Drawdown from entry: (-26.6%)
Signal date: 8/8/2011
NDX % +(-): +35.1%
Max. % Drawdown from entry: (-1.1%)
Signal date: 1/13/2016
NDX % +(-): +14.6%
Max. % Drawdown from entry: (-5.6%)
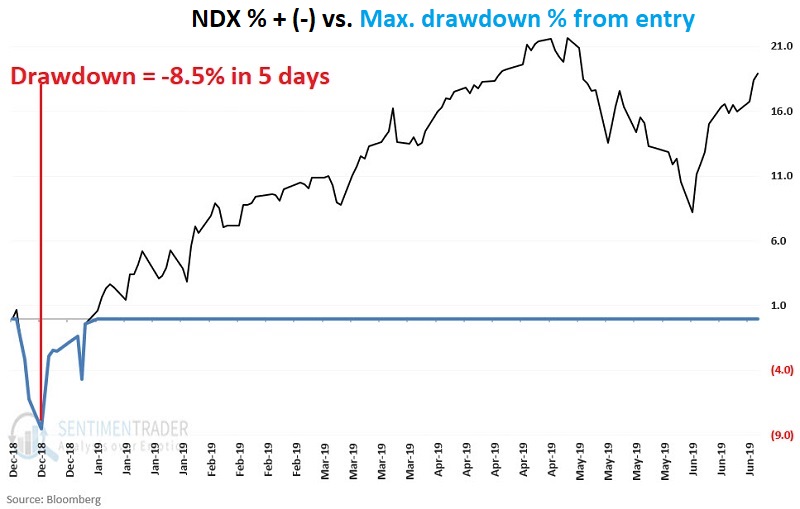
Signal date: 12/17/2018
NDX % +(-): +18.9%
Max. % Drawdown from entry: (-8.5%)
Signal date: 3/11/2020
NDX % +(-): +42.3%
Max. % Drawdown from entry: (-12.6%)
Signal date: 1/24/2022
NDX % +(-): (-14.6%) in 21 trading days (through 2/23)
Max. % Drawdown from entry: (-14.6%) (through 2/23)
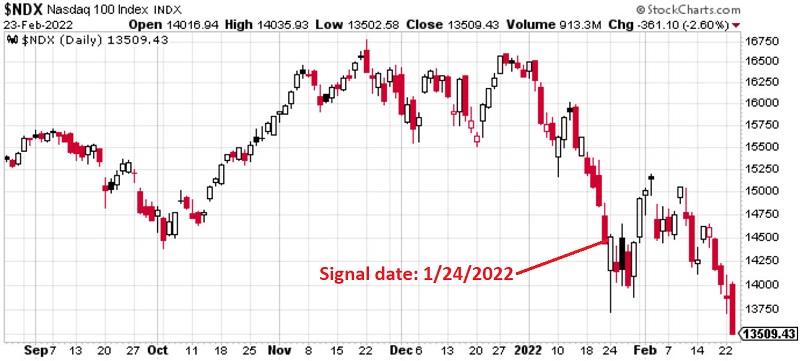
(chart courtesy of StockCharts)
What the research tells us…
Stock market lows are invariably messy and frightening affairs. How long the "final plunge" will last and how far down it may take stocks before finally hitting bottom can involve a great deal of fear and significant (at least temporarily) lost capital. Like most of the signals before it, the signal from the Nasdaq new high/new low ratio on 1/24/2022 tuned out to be early as the Nasdaq 100 Index has plunged another -15% in just 21 trading days.
If history is a guide, this indicator suggests that a meaningful bottom is in the process of forming. Unfortunately, a) there are no guarantees, and b) things could still get much worse before they get better.