Products
SentimenTrader Trading Tools
‍
Backtest Engine
My Trading Toolkit
Correlation Analysis
Seasonality
Indicators & Data API
‍
Proprietary Indicators & Charts
Market Data API
Strategies & Scanner
‍
50+ Trading Strategies
Smart Stock Scanner
Research Reports
‍
Research Solutions
Reports Library
Free Resources
Simple Backtest Calculator
Simple Seasonality Calculator
The Kelly Criterion Calculator
Sentiment Geo Map
Public Research Reports
Education
Sentiment Indicators
Technical Indicators
Pricing
Company
About
In the News
Testimonials
Client Success Stories
Contact
Log inLoginSign up
< BACK TO ALL REPORTS

New Feature - Screens

Eric D. Brown
2016-11-07
null

Over the weekend, we released a couple new feature on the site called "Screens". With this feature, users can now begin to screen for setups that have historically led to good returns.

The first screens are combining Sentiment & Seasonality for commodities and ETF's.  A form of these screens was provided in the blog post titled "Seasonality And Sentiment Screen".

The screens can be found in their respective areas on the site (under  the Commodities and Sector and Country ETF's menus) as well as in the "More" menu (all screens will be added to the More -> Screens menu).

The screens are built to highlight those ETF's and Commodities that have Sentiment readings (via our Optix indicator) and Seasonality returns that fall into specific ranges. For example, an ETF with an Optix value <= 20 and Seasonality returns >= 0.5% would be considered one to watch for a move higher.  In these screens, the ETF's and Commodities that meet our criteria are highlighted Green (expectations to move higher) and Red (expectations to move lower).

Note: The description on the Screens page (expand the Table Description navigation menu to see the descriptions) are incorrect for the ETF screen and will be updated soon.  The values should be:

  • ETF's:

    • Seasonality Returns >= 0.5%, Optix <= 20 - Positive expectations
    • Seasonality Returns <= -0.5%, Optix <= 80 - Negative expectations

The screens are available at:

  • ETF Sentiment & Seasonality Screen
  • Commodity Sentiment & Seasonality Screen

Samples of the screens for ETF's and Commodities are provided below.


[caption id="attachment_953" align="aligncenter" width="601"]Sample ETF Screen Nov 7 2016 
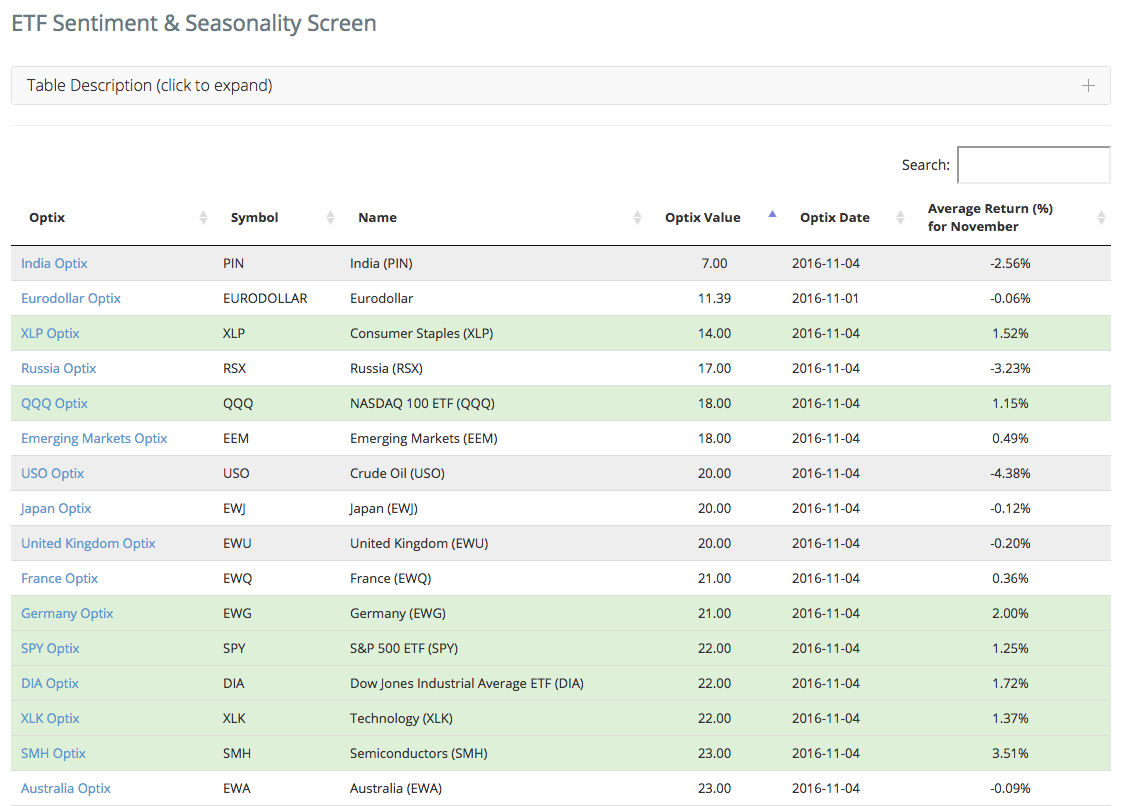
Figure 1: Sample ETF Screen Nov 7 2016[/caption]

[caption id="attachment_952" align="aligncenter" width="600"]Sample Commodities Screen Nov 7 2016 
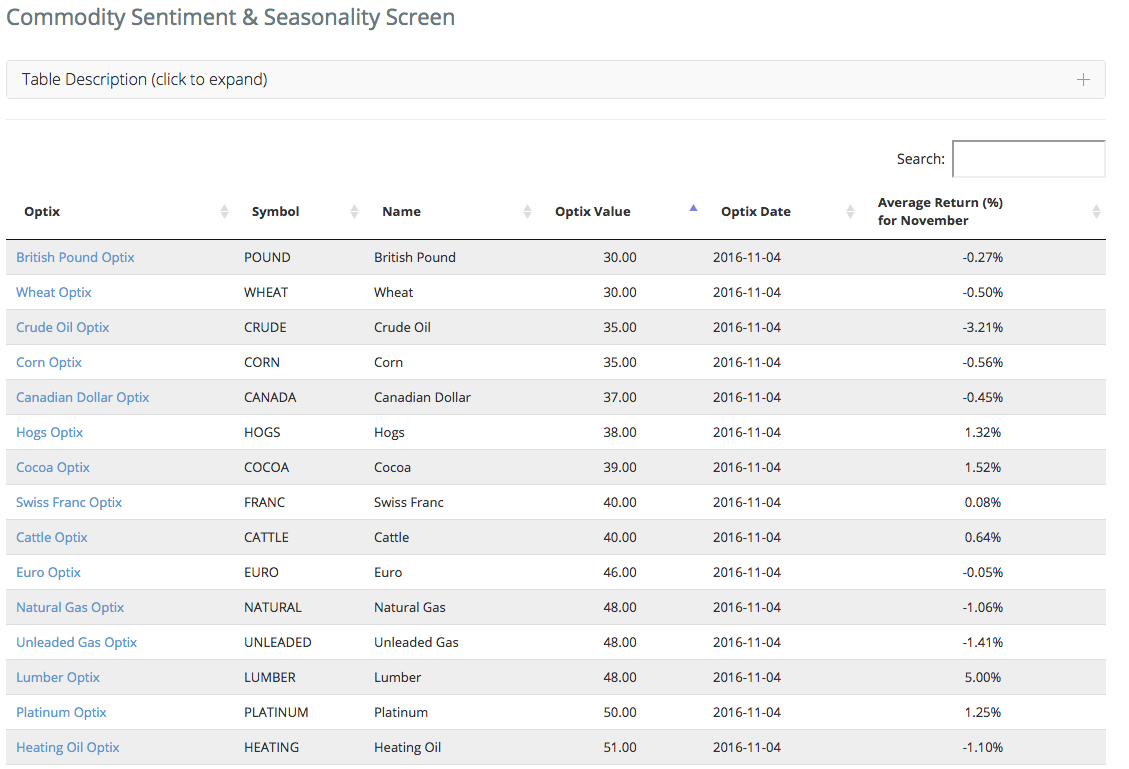
Figure 2: Sample Commodities Screen Nov 7 2016[/caption]

As always, remember to keep an eye on the "Whats New" page to keep informed of changed to the site.

Sorry, you don't have access to this report

Upgrade your subscription plan to get access
Go to Dasboard
PRODUCTS
SentimenTrader
Trading Tools
Indicators & Data API
‍
Strategies & Scanner
‍
Research Reports
FREE
RESOUrCES
Simple Backtest
Calculator
Simple Seasonality
Calculator
The Kelly Criterion
Calculator
Sentiment Geo Map
‍
Public Research Reports
‍
Education
Sentiment Indicators
‍
Technical Indicators
‍
Pricing
Bundle pricing
‍
FAQ
‍
Announcements
‍
COMPANY
‍
About
‍
In the News
‍
Testimonials
‍
Client Success Stories
CONTACT
‍
General Inquiries
‍
Media Inquiries
‍
Financial Professionals Inquiries
‍
© 2025 Sundial Capital Research Inc. All rights reserved.
Setsail Marketing
TermsPrivacyAffiliate Program
Risk Disclosure: Futures and forex trading contains substantial risk and is not for every investor. An investor could potentially lose all or more than the initial investment. Risk capital is money that can be lost without jeopardizing ones’ financial security or life style. Only risk capital should be used for trading and only those with sufficient risk capital should consider trading. Past performance is not necessarily indicative of future results.

Hypothetical Performance Disclosure: Hypothetical performance results have many inherent limitations, some of which are described below. No representation is being made that any account will or is likely to achieve profits or losses similar to those shown; in fact, there are frequently sharp differences between hypothetical performance results and the actual results subsequently achieved by any particular trading program. One of the limitations of hypothetical performance results is that they are generally prepared with the benefit of hindsight. In addition, hypothetical trading does not involve financial risk, and no hypothetical trading record can completely account for the impact of financial risk of actual trading. for example, the ability to withstand losses or to adhere to a particular trading program in spite of trading losses are material points which can also adversely affect actual trading results. There are numerous other factors related to the markets in general or to the implementation of any specific trading program which cannot be fully accounted for in the preparation of hypothetical performance results and all which can adversely affect trading results.

Testimonial Disclosure: Testimonials appearing on this website may not be representative of other clients or customers and is not a guarantee of future performance or success.