New Feature - Plot any indicator as a secondary indicator
Over the weekend we released a new version of the website that now allows users to plot any indicator as a secondary indicator.
Previously, you could only plot similar indicators (e.g., SPY Optix vs DIA Optix) due to technical limitations, but those limitations have been removed. Now you are able to plot almost any indicator as a secondary indicator to any other indicator. Note: I say 'almost' any indicator because seasonality charts are not available to plot against other charts at this time.
A few examples are below.
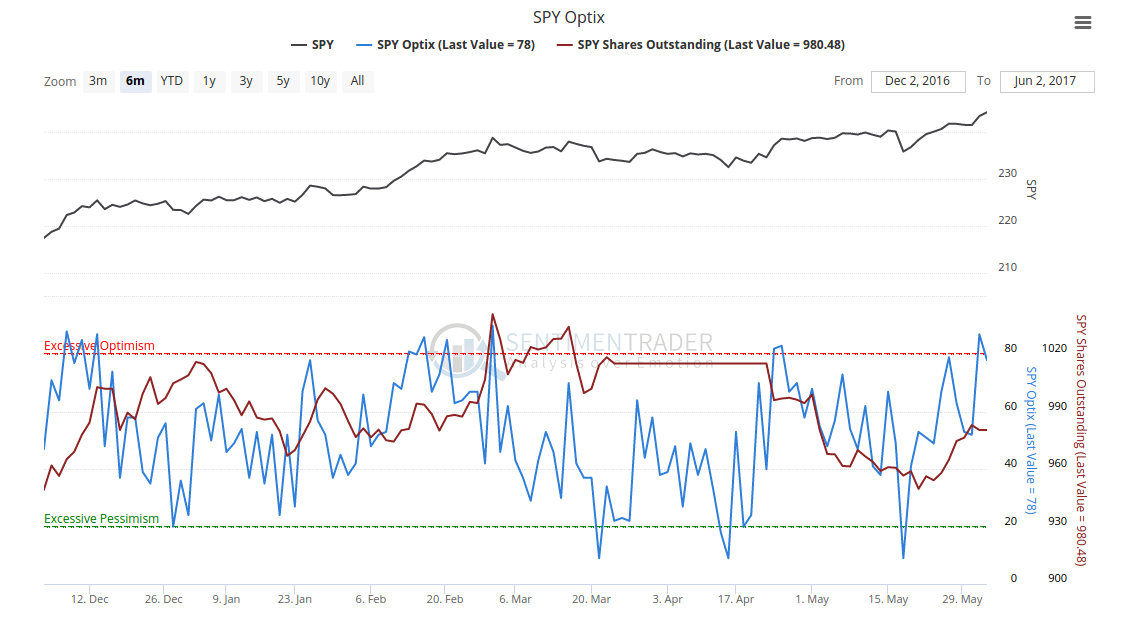
SPY Optix vs SPY Shares Outstanding
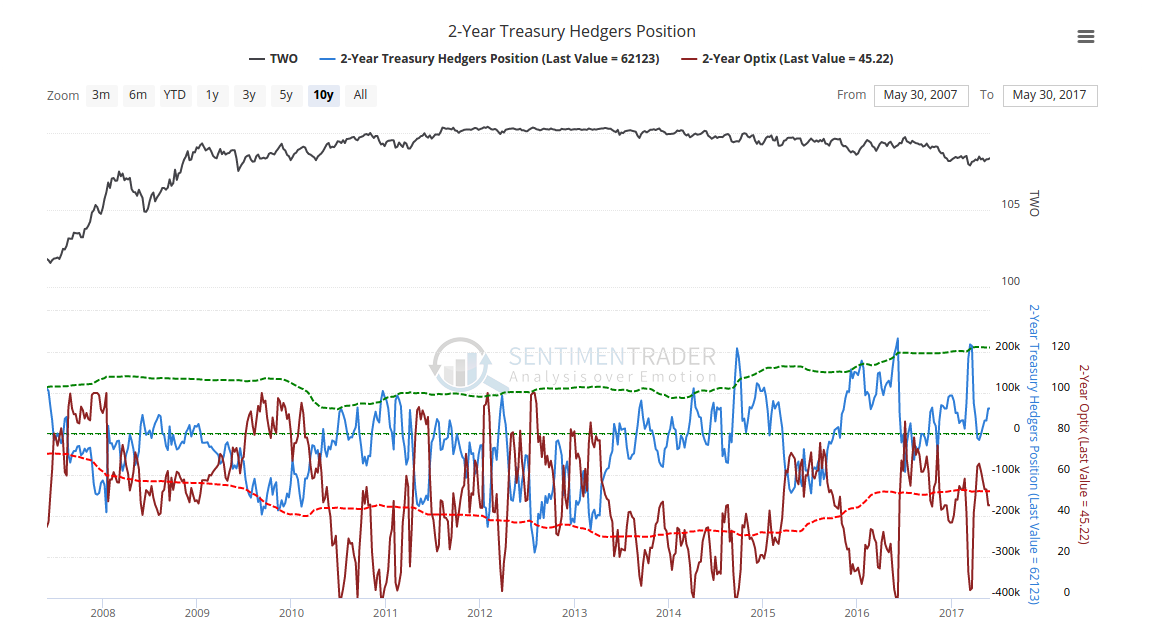
Two Year Hedgers Position vs Two Year Optix
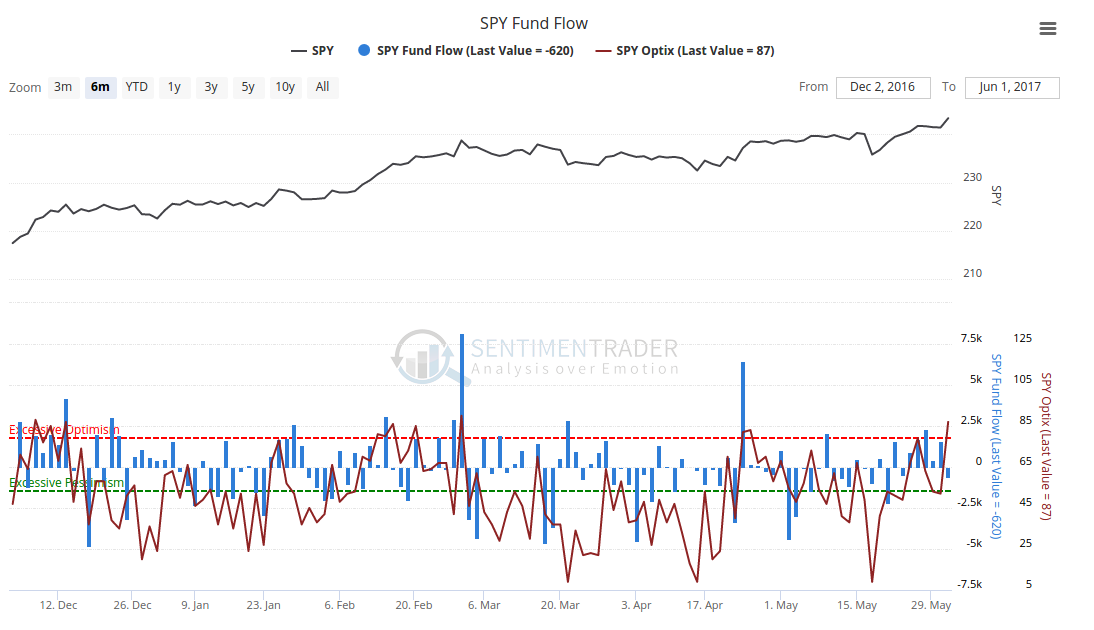
SPY Fund Flow vs Spy Optix
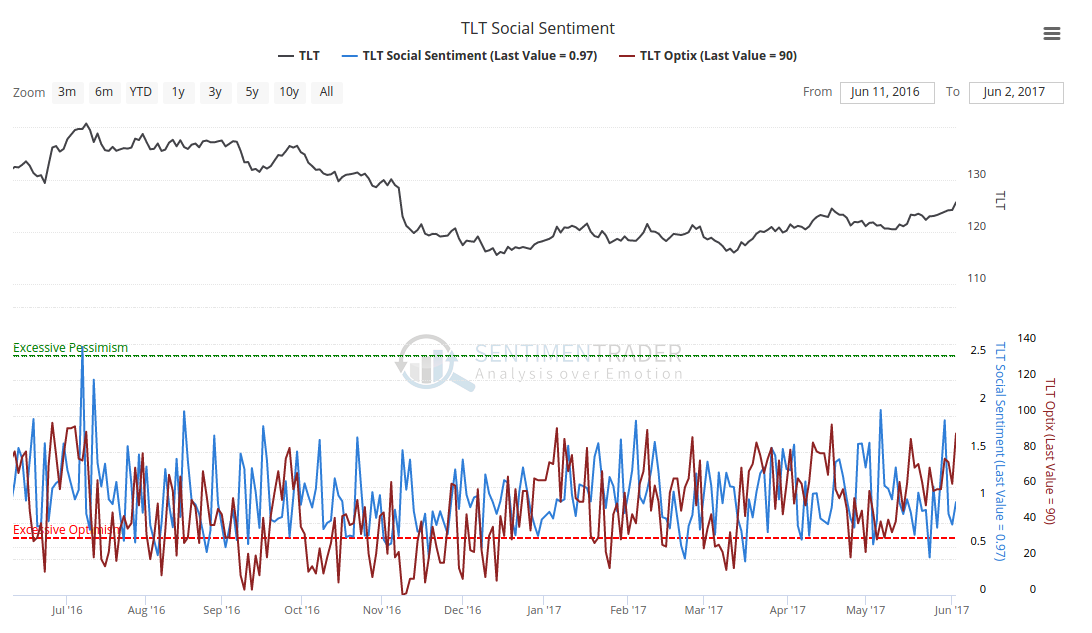
TLT Social Sentiment (Premium Chart) vs TLT Optix