
Never short a dull President

Key points:
- The S&P 500's Average True Range has been elevated since President Trump's inauguration
- It is also significantly higher than it was after the election, suggesting some anxiety about rapid policy changes
- Stocks have done much better after calm periods following an inauguration than they did after volatile ones
A volatile post-inauguration
Chaos. Confusion. Unconstitutional. Pick a hysterical epithet and it's been used in the past few weeks to describe President Trump and, increasingly, Elon Musk.
With sentiment like that and the knowledge that markets abhor uncertainty, it would stand to reason that stocks are being jerked around more than usual. Some of the recent Monday morning gaps down would seem to support that. But it's a mirage.
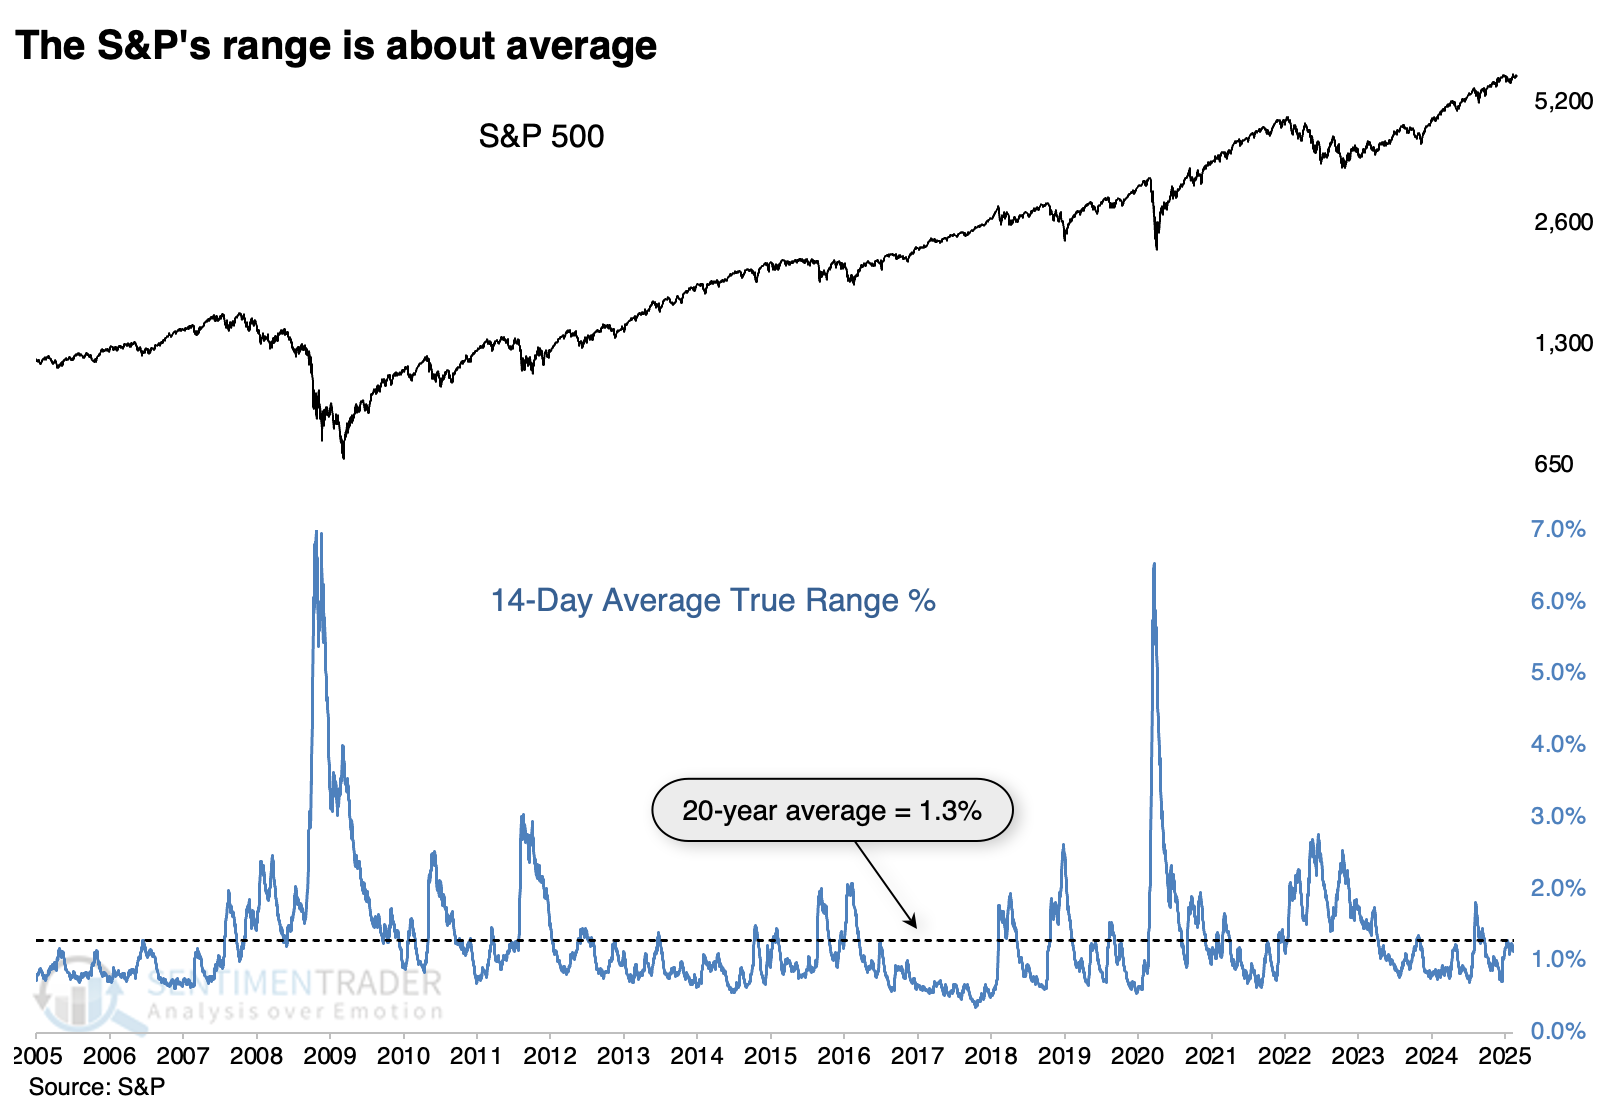
To gauge how volatile price action has been, we'll use the most benchmarked equity index in the world, the S&P 500, and measure its Average True Range (ATR). Per Investopedia:
The true range indicator is taken as the greatest of the following: current high less the current low; the absolute value of the current high less the previous close; and the absolute value of the current low less the previous close. The ATR is then a moving average, generally using 14 days, of the true ranges.
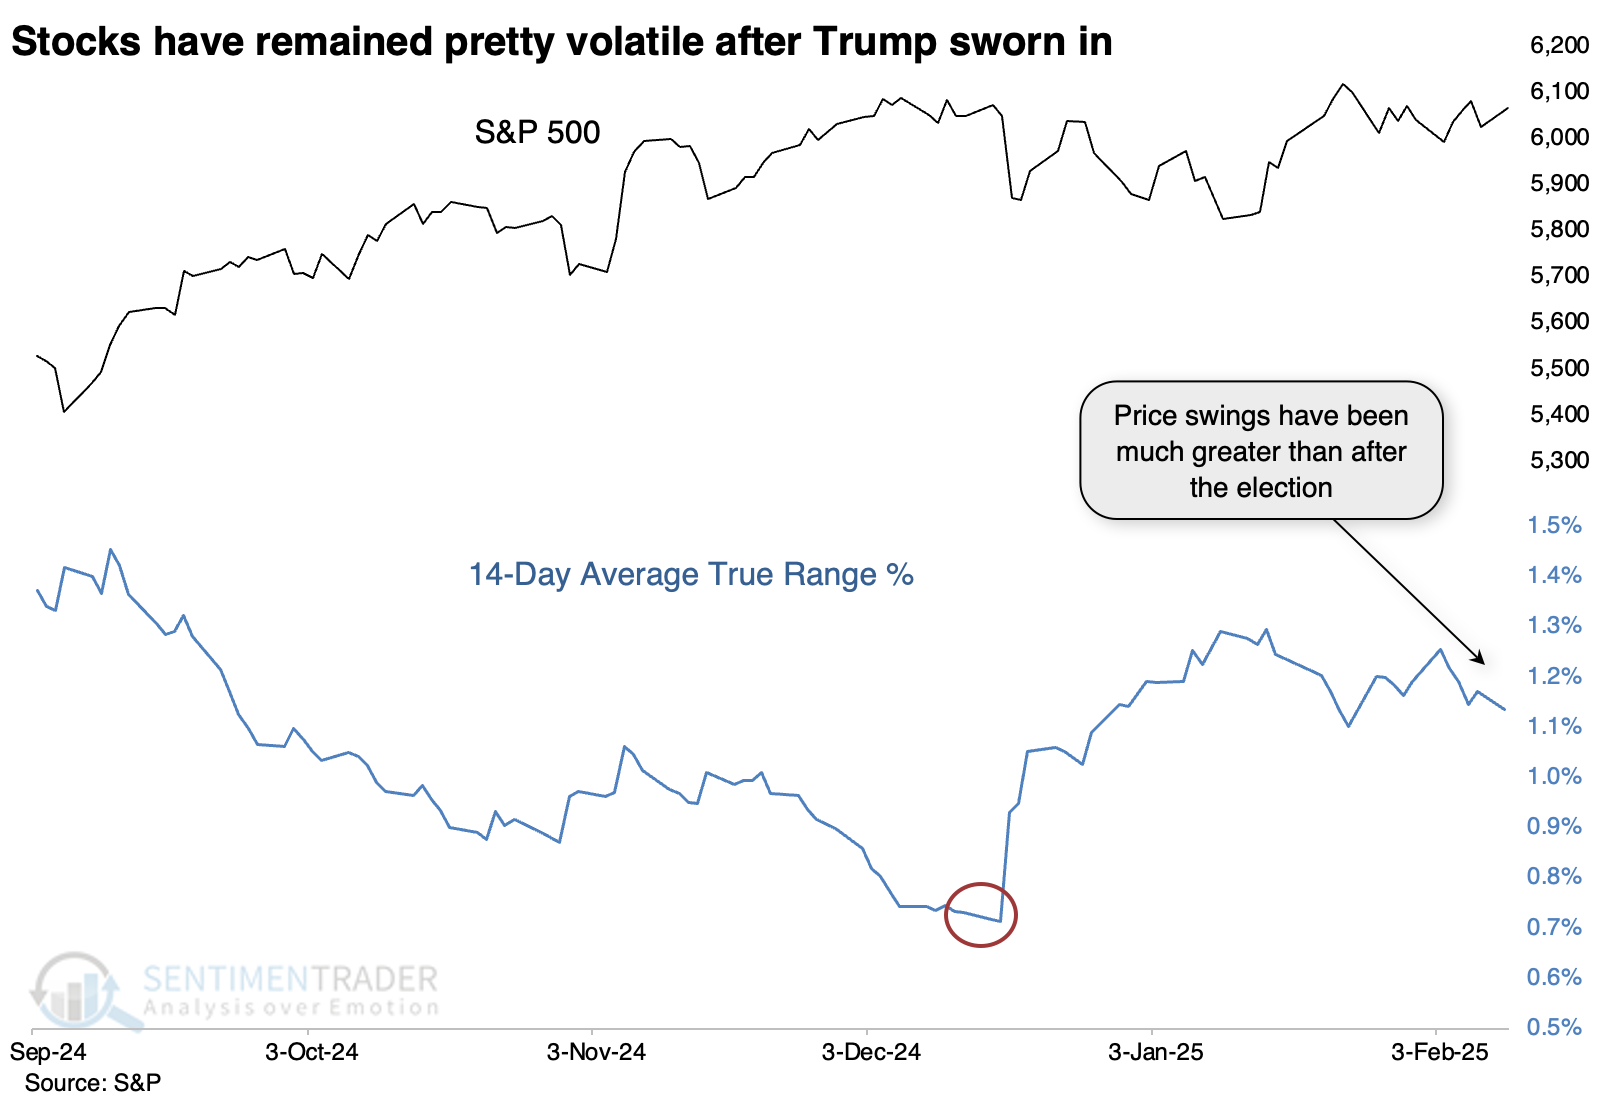
The 14 days since Trump's inauguration have marked the S&P 500's Average True Range at 1.14%. That's actually below the 20-year (and all-time) average of 1.3%.
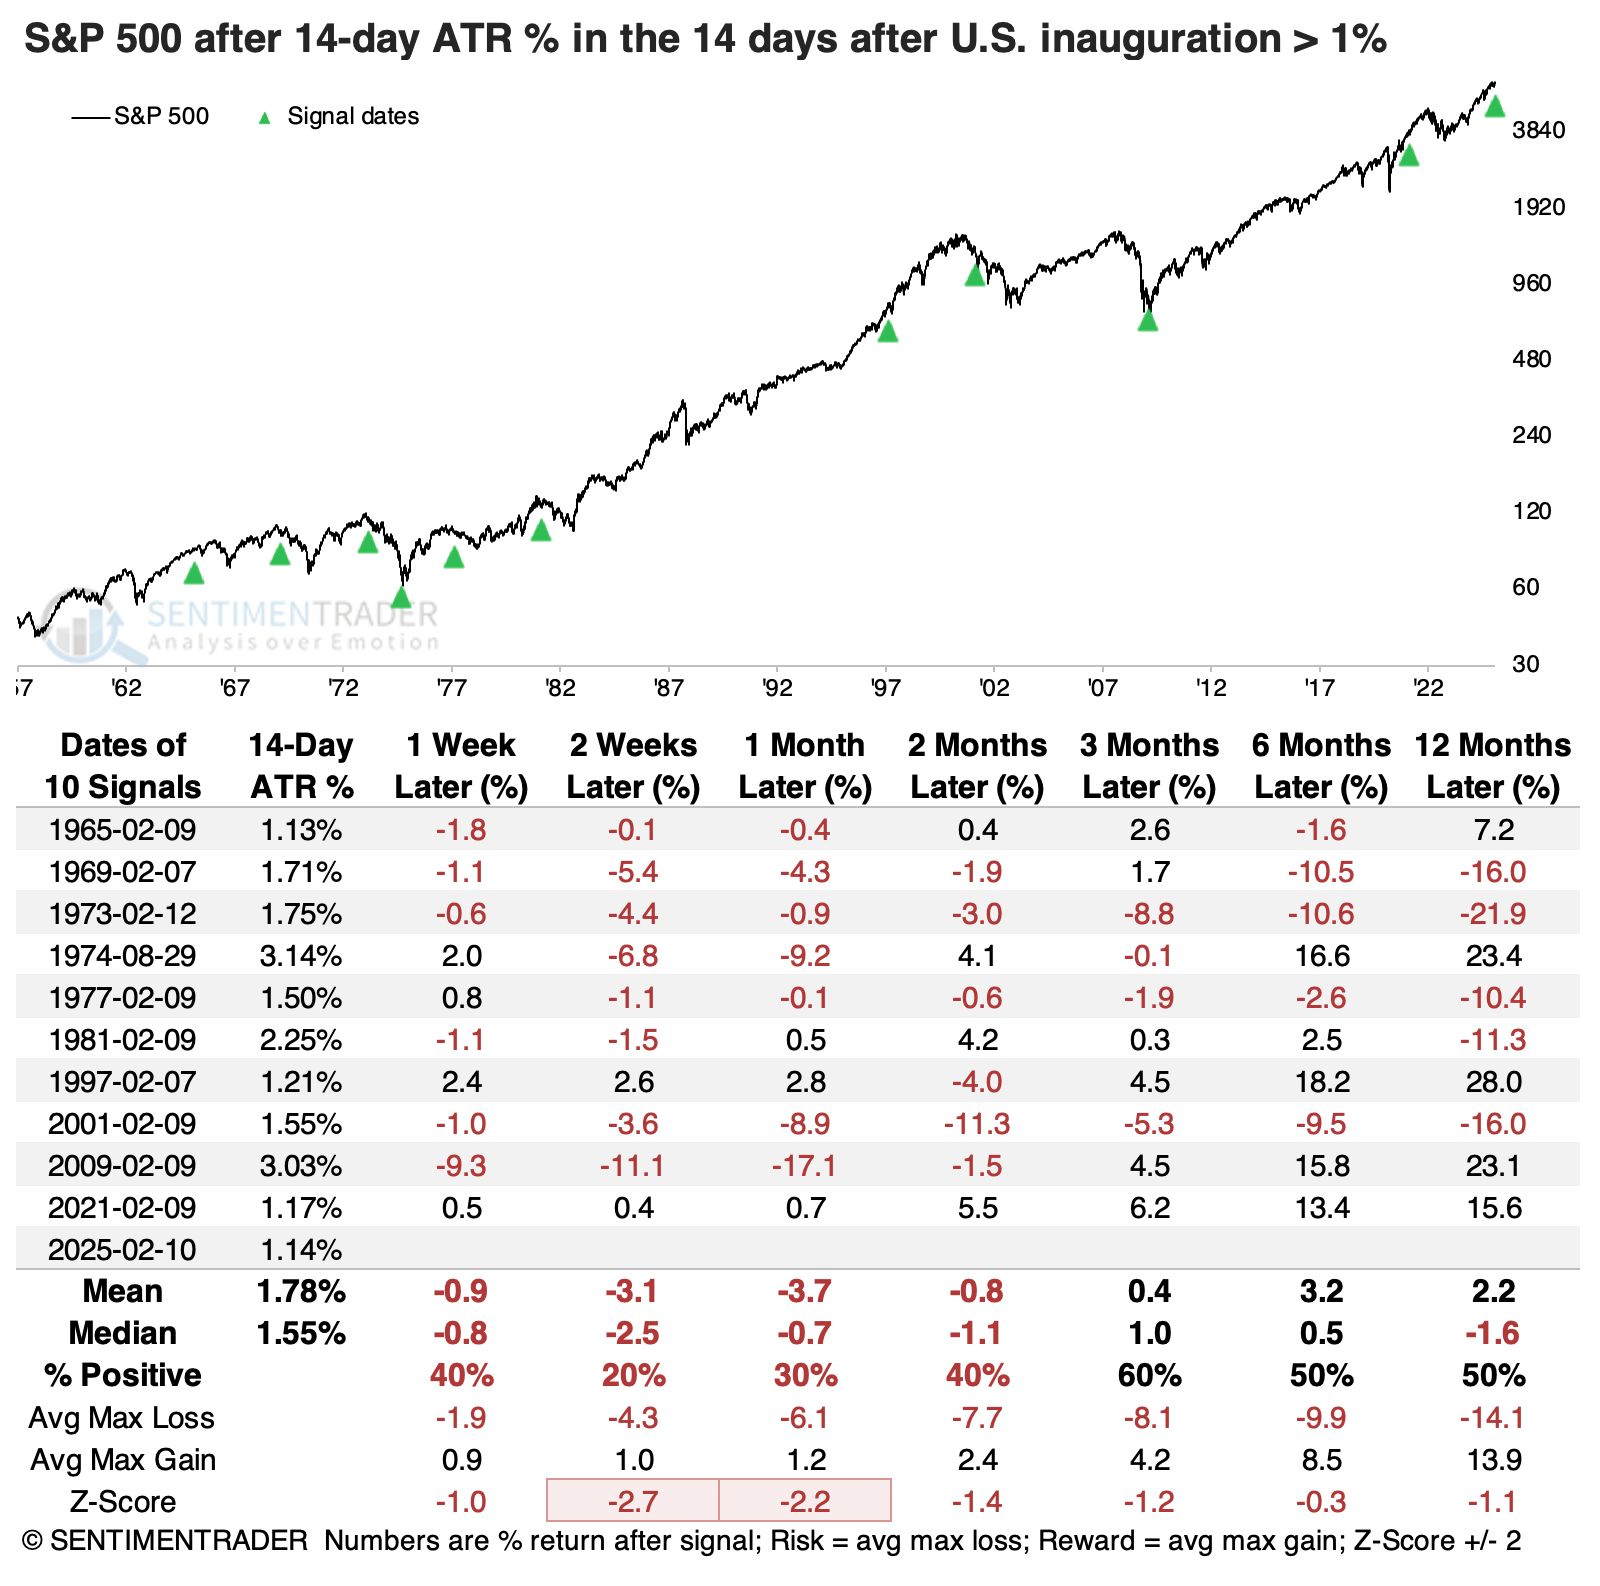
To see how this measures up to past Presidents' precedents, the table below shows when the S&P's ATR was greater than 1% in the 14 days following a U.S. Presidential inauguration. While the current instance barely qualifies, it still does, and it's not that great of a sign.
When investors pushed stocks around by more than an average of 1% following an inauguration, the S&P tended to see more volatility, and losses, in the weeks following. Only 2 signals out of 10 avoided a loss either two or four weeks later.
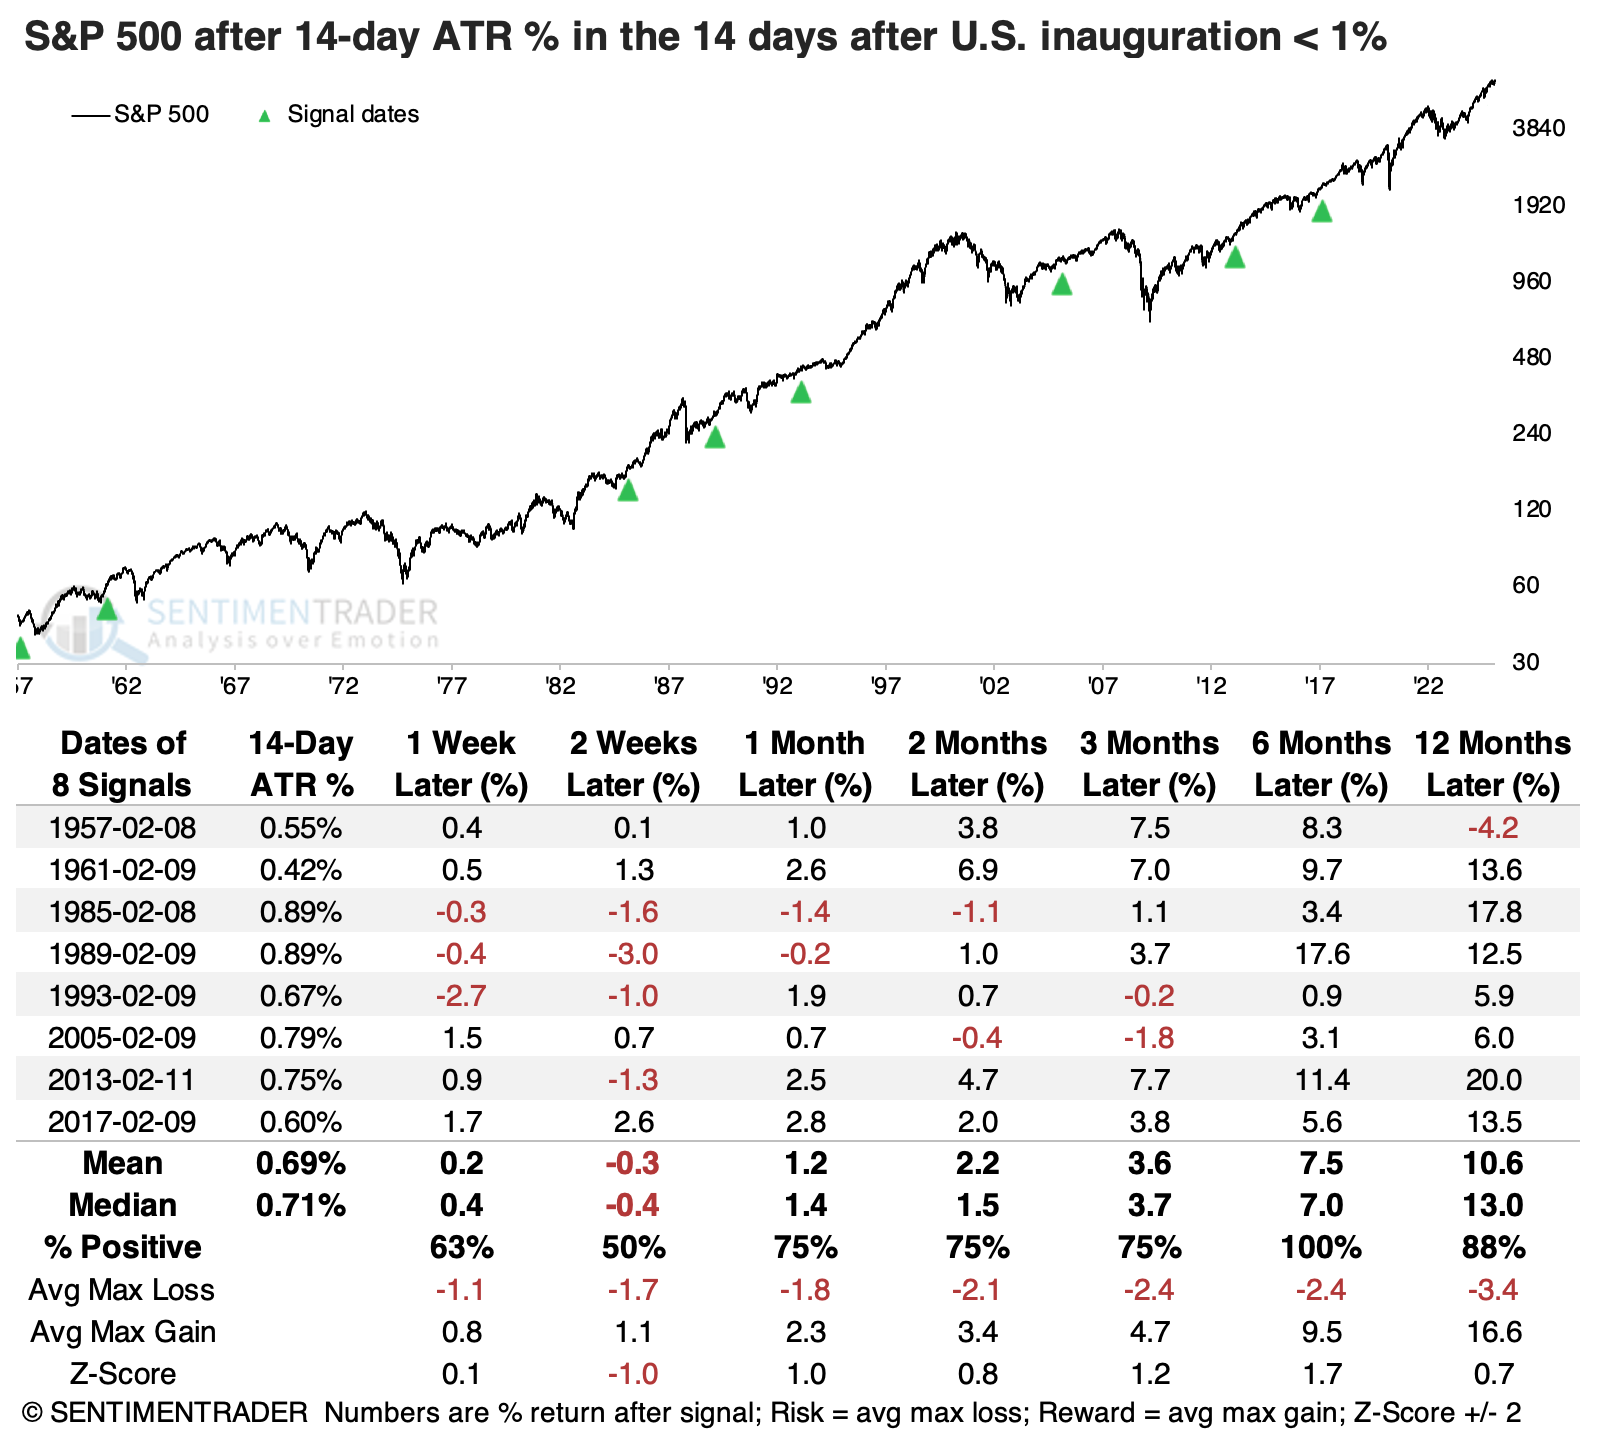
We like to look at counter-examples, so the table below shows the lowest ATR readings 14 days after inauguration. These are times when the S&P moved less than 1% on average. The old adage about never shorting a dull market (or President) seemed evident here, as the S&P's returns, consistency, and risk/reward were remarkably better than the volatile post-inaugurations.
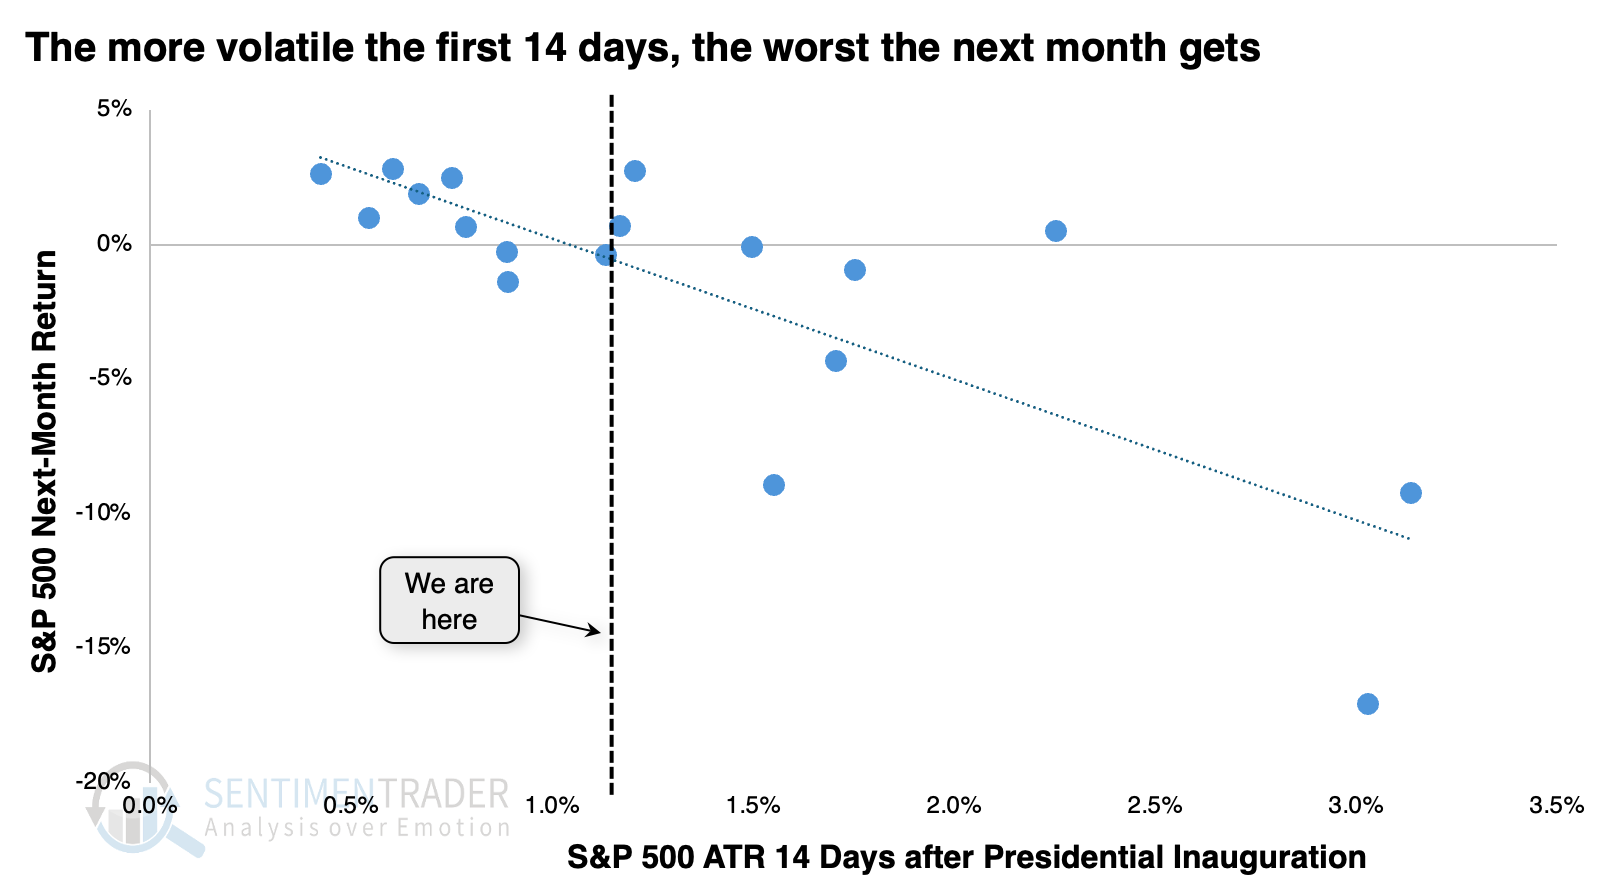
We can see this clearly in the scatter plot below. It shows the S&P's ATR 14 days after inauguration on the x-axis, and the S&P's return over the following month on the y-axis. There is a clear negative correlation - the more volatile the post-inauguration period, the more negative the ensuing returns.
Between the election and inauguration
If the people claiming "agent of chaos" have a point, maybe it's that the ATR has jumped significantly since the election. Investors seemed pleased by the election's outcome and stocks did well, with relatively low volatility. The S&P's ATR plunged to only 0.7% but is significantly higher now that markets have had to digest some of the actual, instead of promised, policy changes.
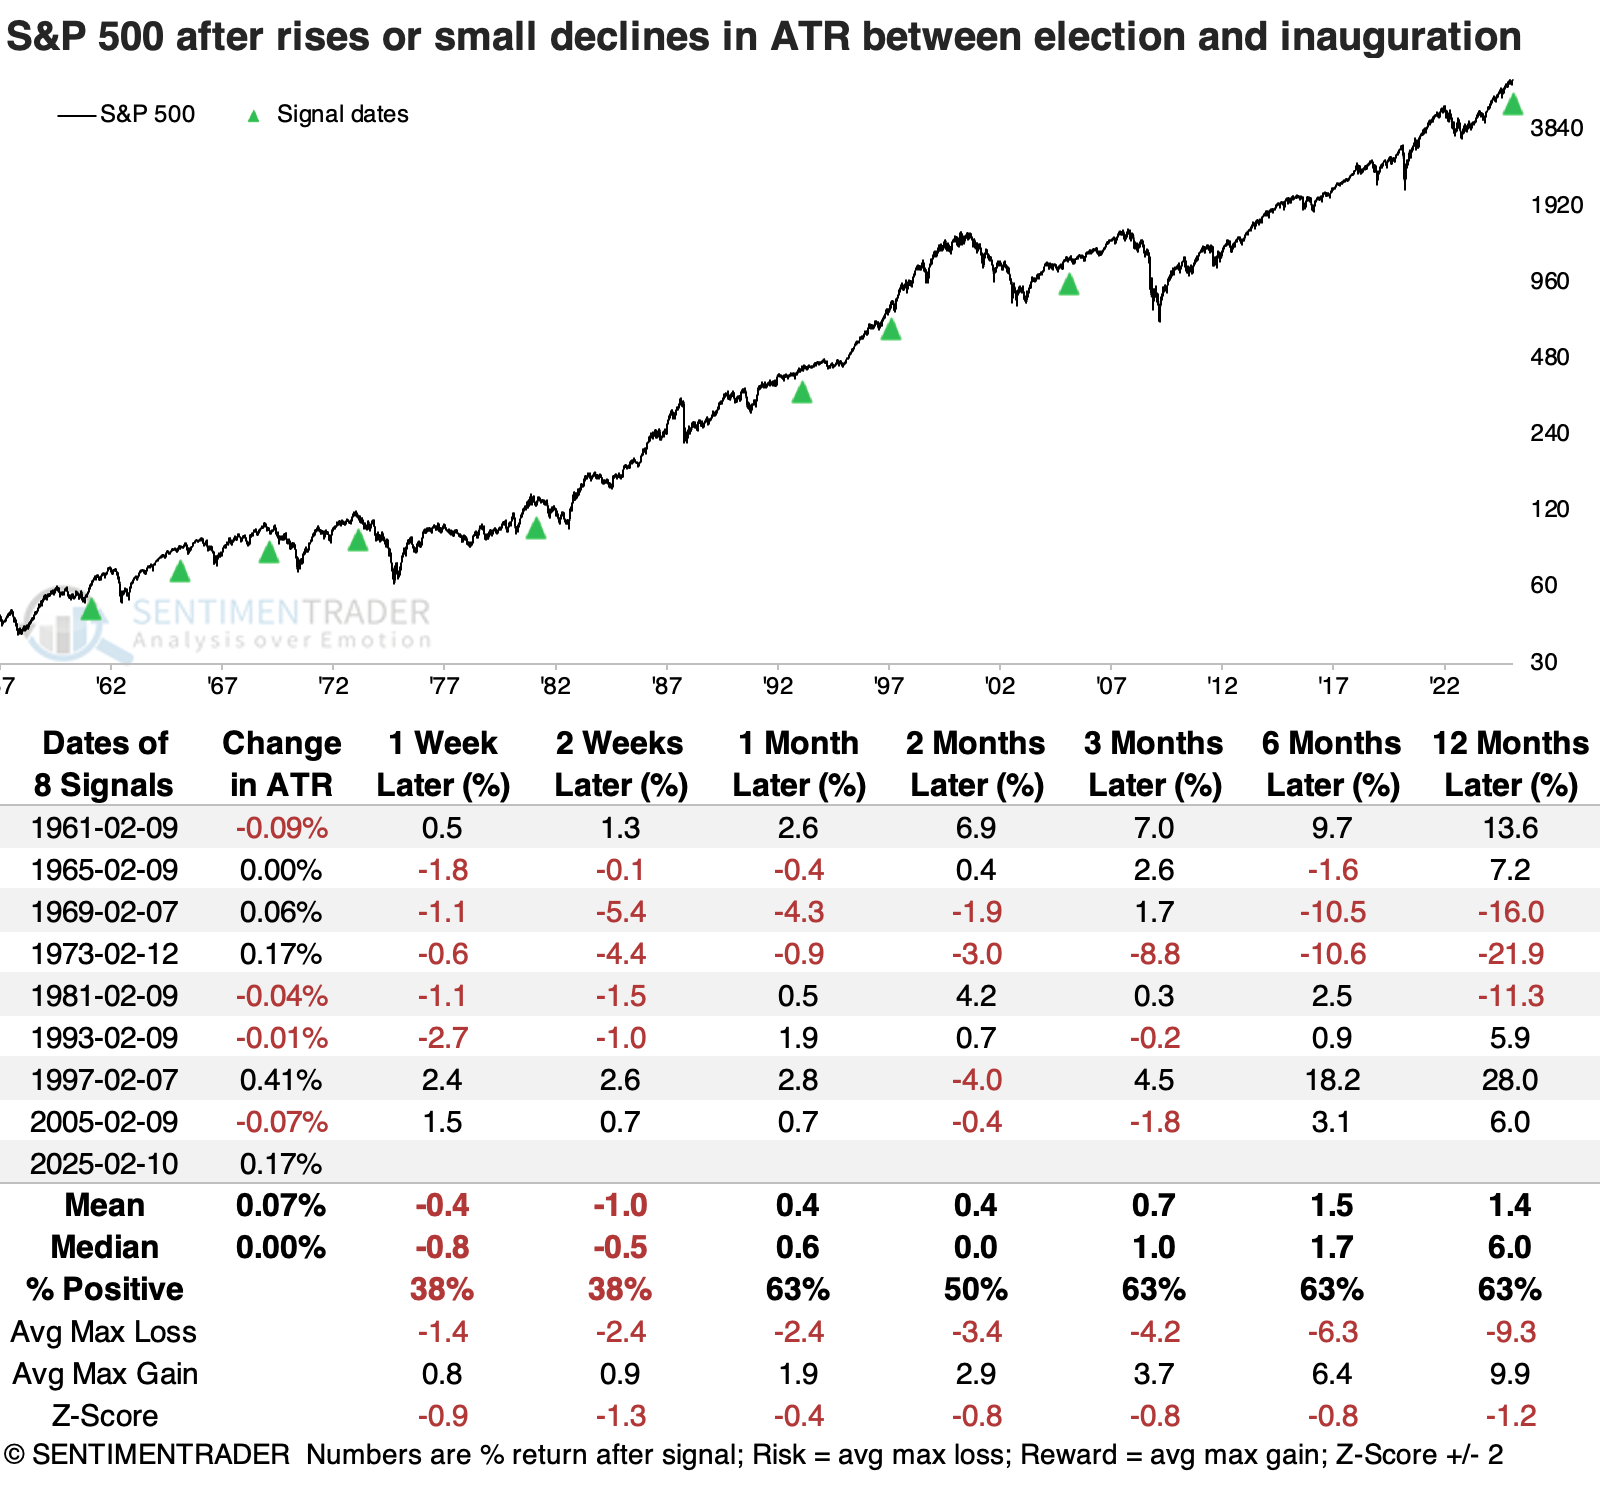
The table below shows those instances when there was the biggest rise (or smallest decline) in ATR between the inauguration and the election. The current signal is tied for the 2nd-largest. Again, returns were relatively poor going forward and below average across all timeframes. Risk was about even to reward, which isn't great.
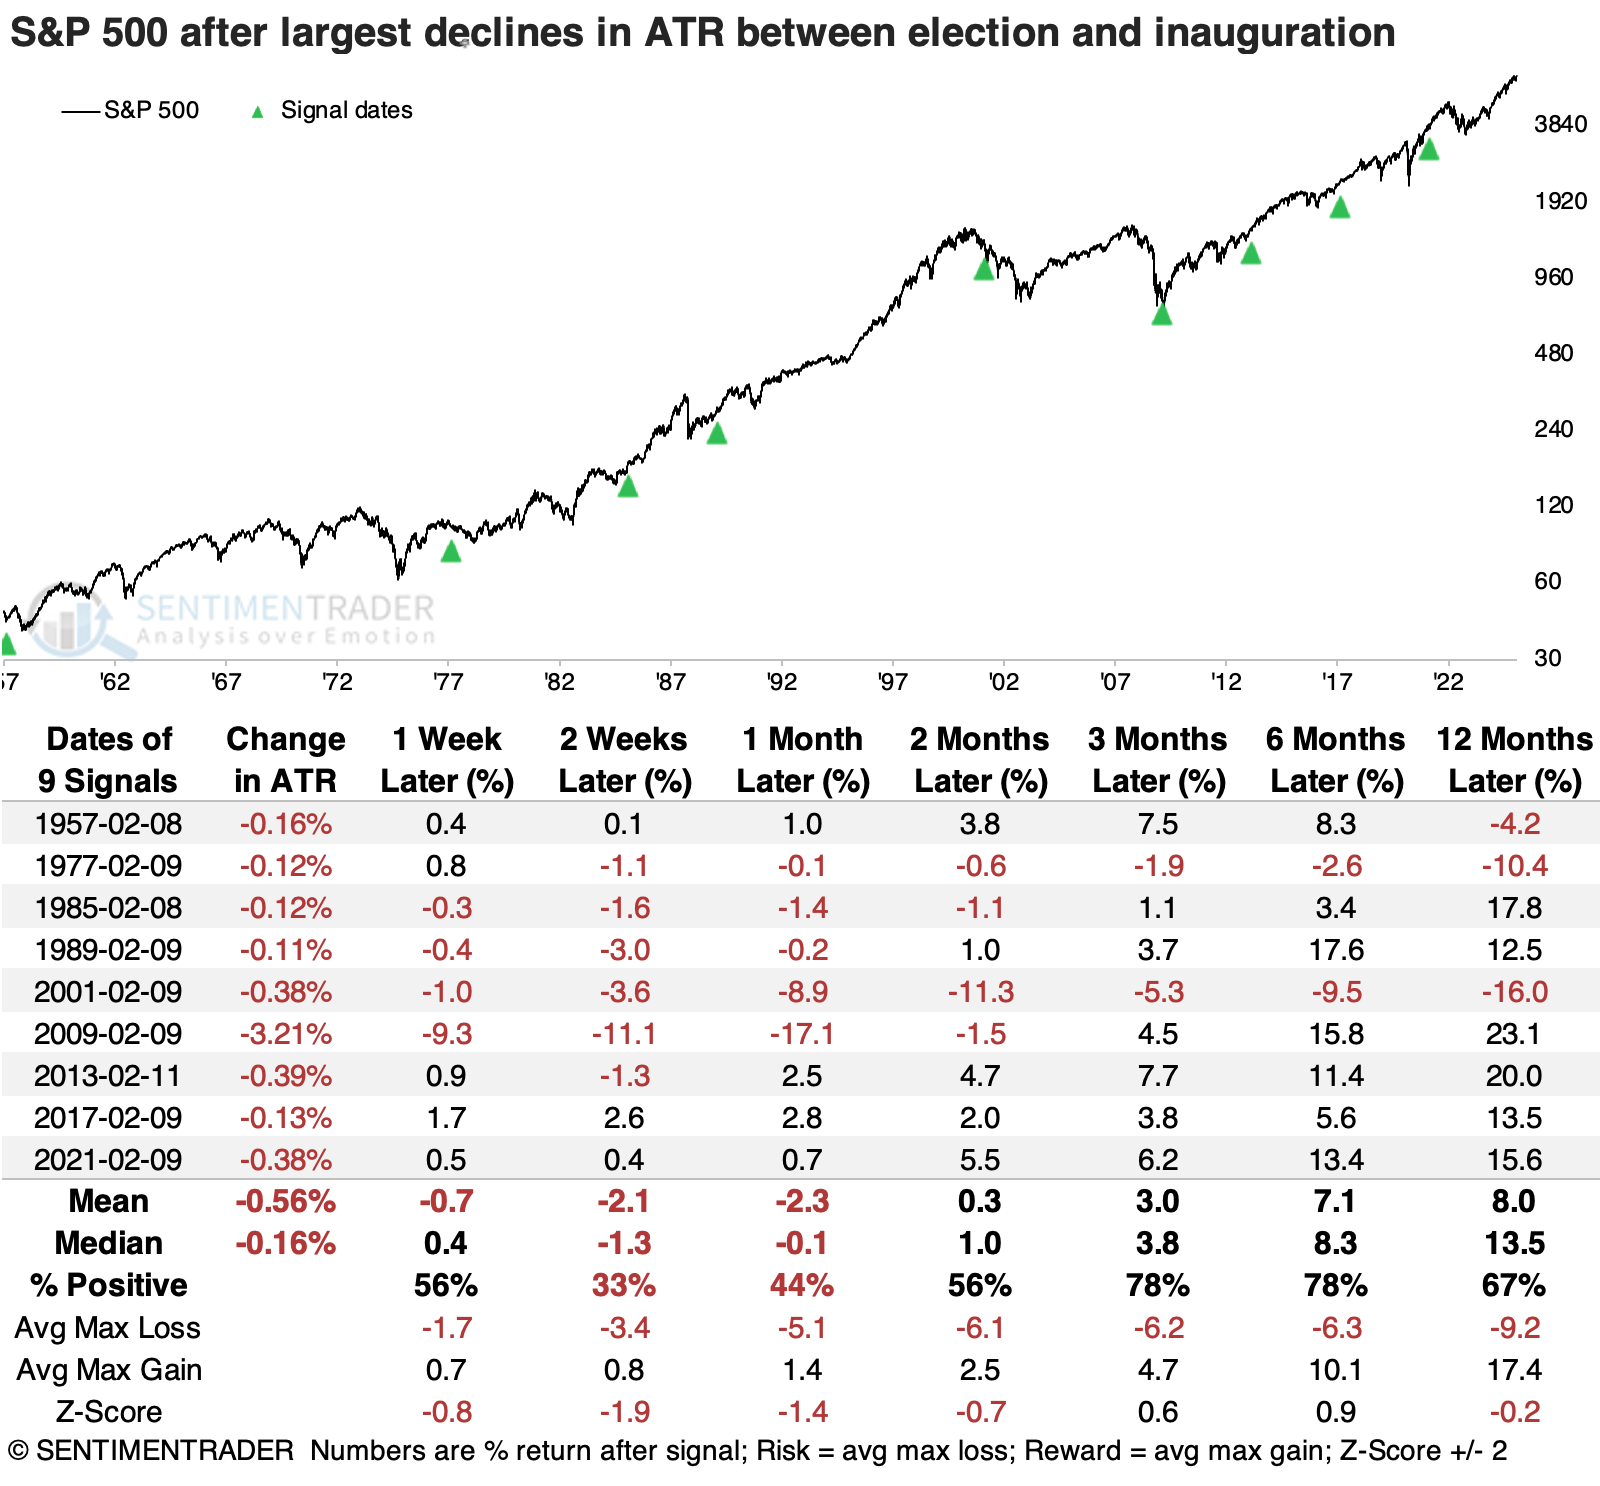
After the biggest declines in ATR between the election and inauguration, short-term returns also were bad, but stocks tended to rebound over the next 3-6 months.
A bad combination
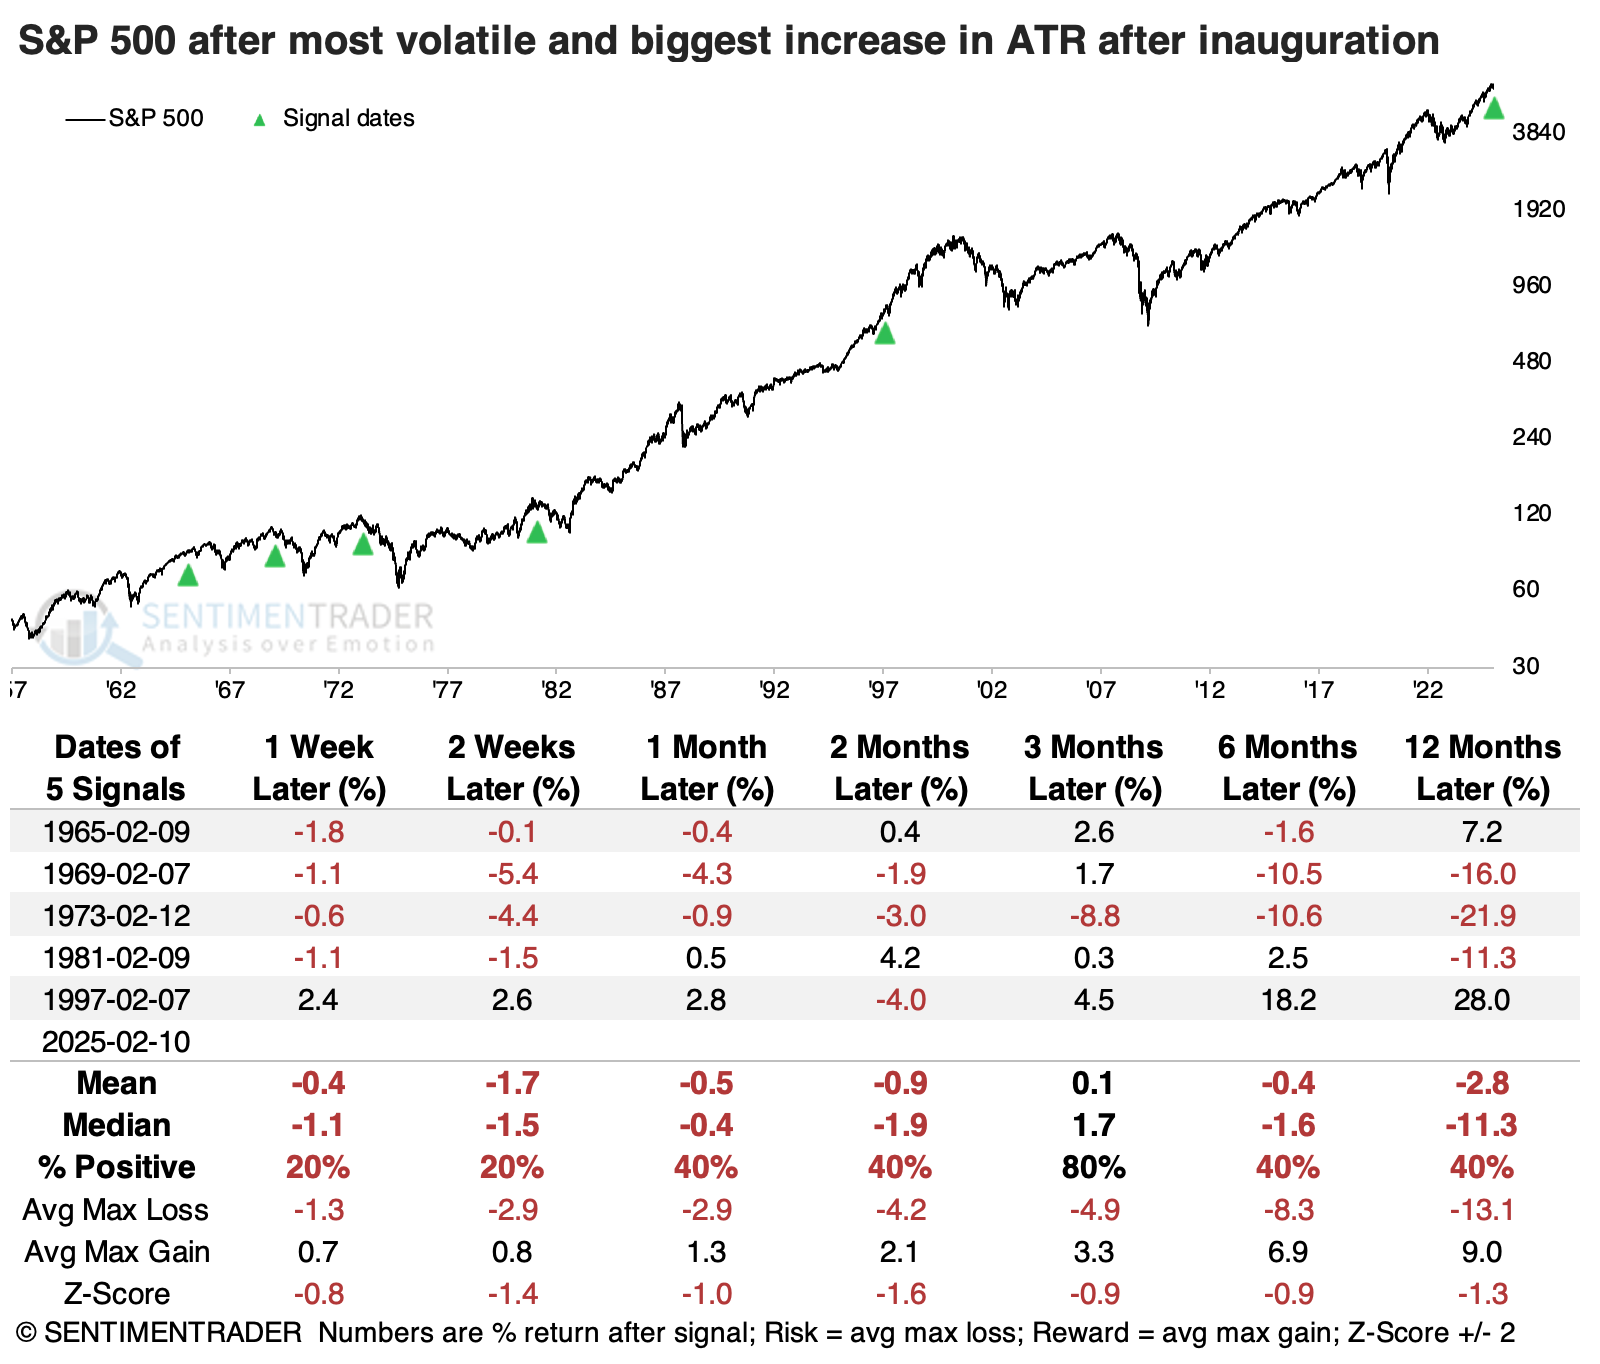
Let's combine the two studies. The table below shows the "worst" combinations, when the S&P's ATR was higher than usual and increased between the election and inauguration. While the S&P sported a gain four out of five times three months later, all but one of them showed a loss either six or twelve months later.
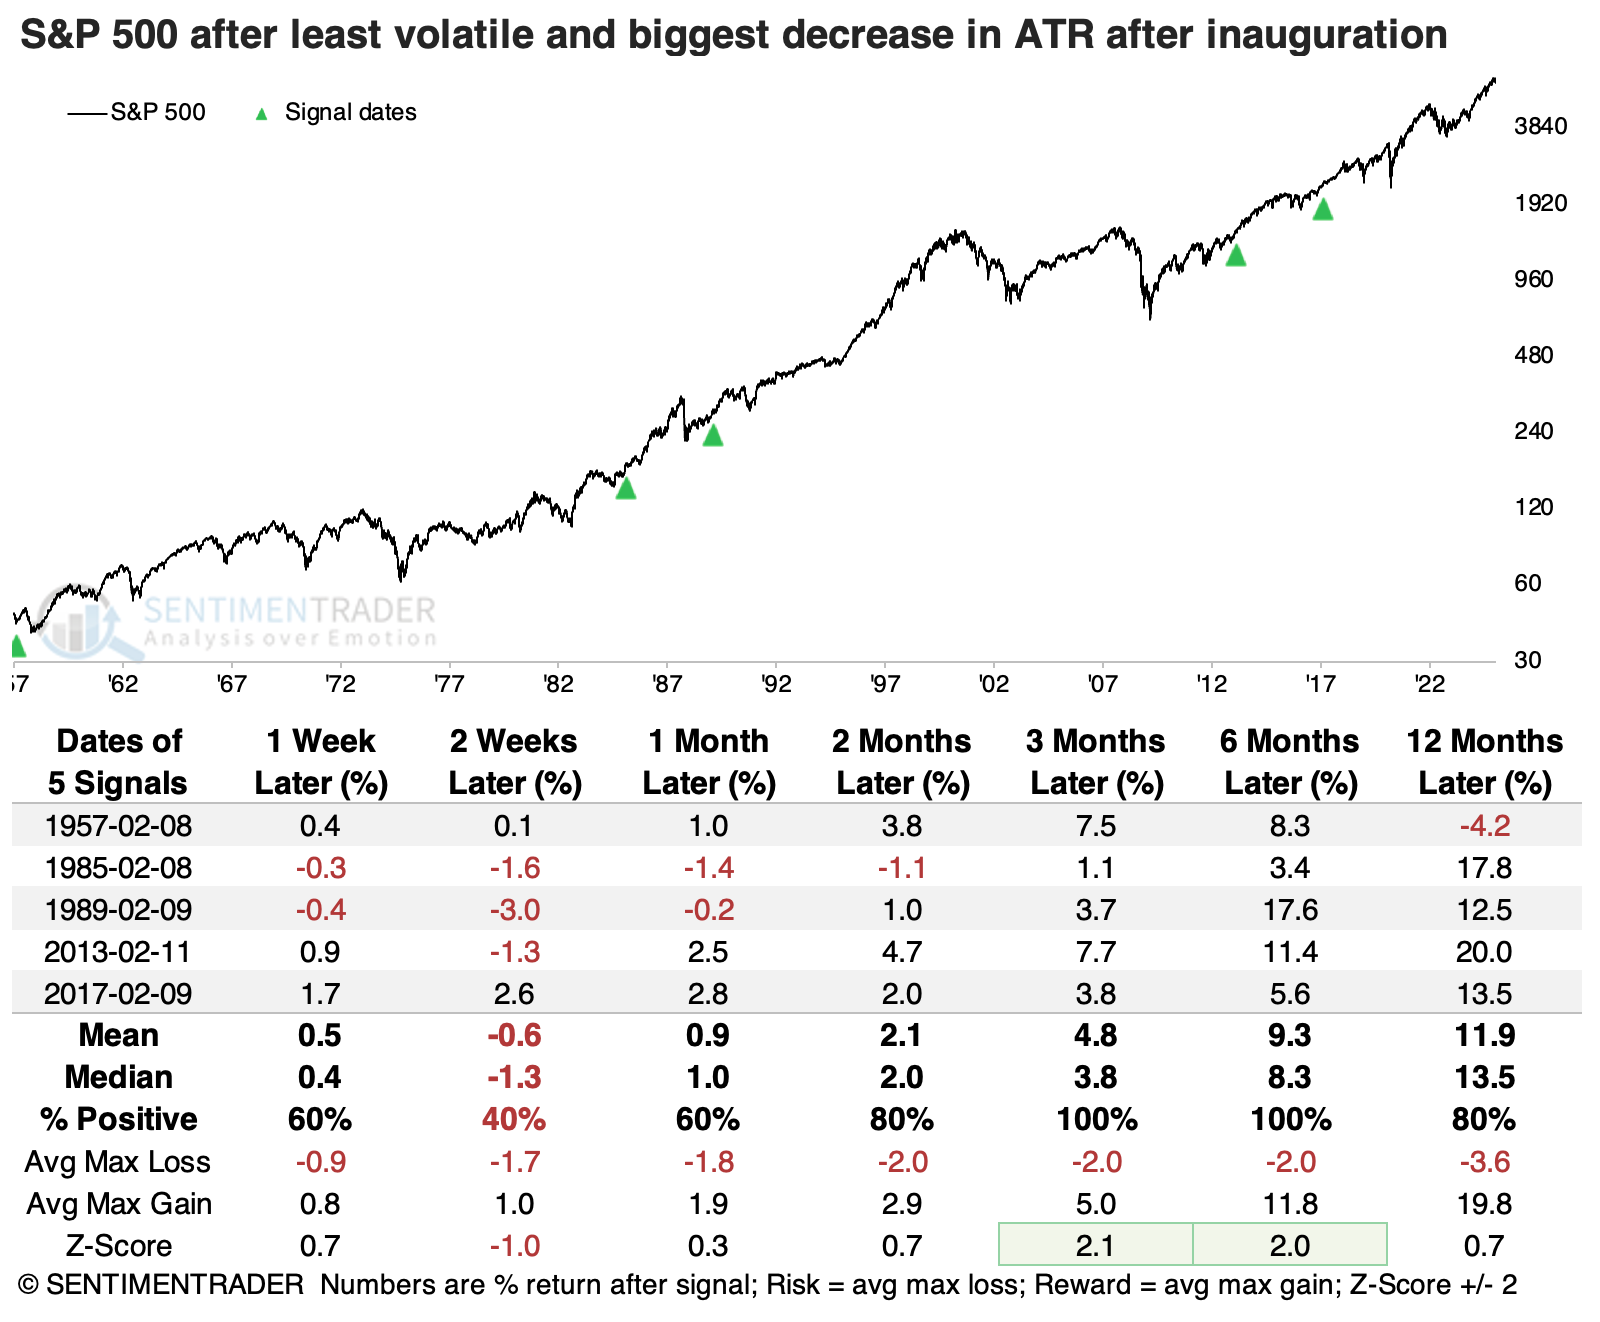
Compare those returns to the opposite scenarios, when stocks moved the least and showed the largest decrease in ATR between the election and inauguration. Only one suffered more than a -5% pullback within the following year.
What the research tells us...
Never short a dull market, and never short a dull President. When investors take the first few weeks of a President's term well and don't see any pressing need to make drastic portfolio changes, it bodes well for returns in the weeks and months to come. But when stocks get pushed around more, it's a sign of uncertainty, and that uncertainty tends to persist.
While the S&P's range over the past few weeks hasn't been abnormally large, it is above where it was after many other inaugurations. And it's significantly higher than it was 14 days after the election. That suggests investors are a bit anxious about the constant barrage of policy changes, and that anxiety tends to feed on itself. The best sign that investors could hope for isn't necessarily political, it is that stocks calm down and the ATR moves back below 1%.